Naar mijn mening (en enkele anderen hier) ontbreekt in het nieuwste IPCC-rapport een grafiek die de toekomst vergelijkt met het vorige millenium. Dus hebben we die, gebruik makend van verschillende figuren uit het IPCC rapport maar eens samen gezet. Hieronder het resultaat met daaronder de uitleg (in het Engels).
Wouter
Bron: onderdelen figuur: IPCC 4AR.
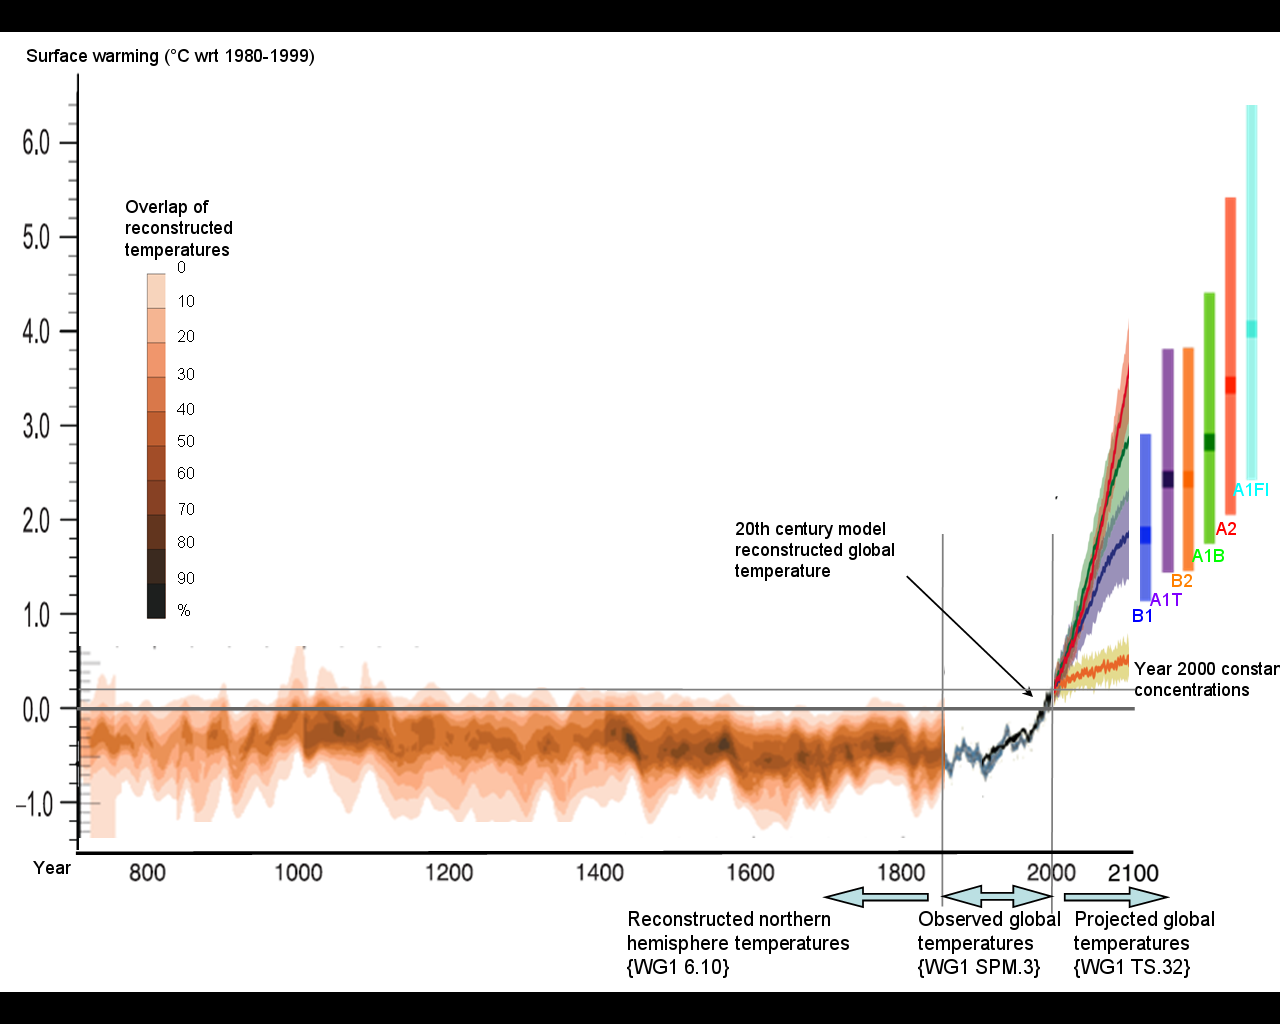
Left: Records of Northern hemisphere temperature variation during the last 1.3 kyr. Overlap of the published multi-decadal time scale uncertainty ranges of all temperature reconstructions identified in 4AR-WG1 Table 6.1 (except for RMO2005 and PS2004), with temperatures within ±1 standard error (SE) of a reconstruction ‘scoring’ 10%, and regions within the 5 to 95% range ‘scoring’ 5% (the maximum 100% is obtained only for temperatures that fall within ±1 SE of all 10 reconstructions). The HadCRUT2v instrumental temperature record is shown in black. All series have been smoothed with a Gaussian-weighted filter to remove fluctuations on time scales less than 30 years; smoothed values are obtained up to both ends of each record by extending the records with the mean of the adjacent existing values.
Middle: Observed changes in global average surface temperature (blue). Smoothed curves represent decadal average values while circles show yearly values. The shaded areas are the uncertainty intervals estimated from a comprehensive analysis of known uncertainties. In black, the mean model temperature for the climate of the 20th century experiments is shown.
Right: Solid color lines are multi-model global averages of surface warming for scenarios A2, A1B and B1, shown as continuations of the 20th century simulations. These projections also take into account emissions of short-lived GHGs and aerosols. The pink line is not a scenario, but is for AOGCM simulations where atmospheric concentrations are held constant at year 2000 values. The bars at the right of the figure indicate the best estimate (solid line within each bar) and the likely range assessed for the six SRES marker scenarios at 2090-2099.
All surface temperature anomalies represent anomalies (°C) from the 1981 to 2000 mean.
Wouter
Bron: onderdelen figuur: IPCC 4AR.
Left: Records of Northern hemisphere temperature variation during the last 1.3 kyr. Overlap of the published multi-decadal time scale uncertainty ranges of all temperature reconstructions identified in 4AR-WG1 Table 6.1 (except for RMO2005 and PS2004), with temperatures within ±1 standard error (SE) of a reconstruction ‘scoring’ 10%, and regions within the 5 to 95% range ‘scoring’ 5% (the maximum 100% is obtained only for temperatures that fall within ±1 SE of all 10 reconstructions). The HadCRUT2v instrumental temperature record is shown in black. All series have been smoothed with a Gaussian-weighted filter to remove fluctuations on time scales less than 30 years; smoothed values are obtained up to both ends of each record by extending the records with the mean of the adjacent existing values.
Middle: Observed changes in global average surface temperature (blue). Smoothed curves represent decadal average values while circles show yearly values. The shaded areas are the uncertainty intervals estimated from a comprehensive analysis of known uncertainties. In black, the mean model temperature for the climate of the 20th century experiments is shown.
Right: Solid color lines are multi-model global averages of surface warming for scenarios A2, A1B and B1, shown as continuations of the 20th century simulations. These projections also take into account emissions of short-lived GHGs and aerosols. The pink line is not a scenario, but is for AOGCM simulations where atmospheric concentrations are held constant at year 2000 values. The bars at the right of the figure indicate the best estimate (solid line within each bar) and the likely range assessed for the six SRES marker scenarios at 2090-2099.
All surface temperature anomalies represent anomalies (°C) from the 1981 to 2000 mean.
Bericht laatst bijgewerkt: 28-11-2007 12:32