First Images from the Global Precipitation Mission
Bericht van: Rutger (Meppel)
, 26-03-2014 08:09
...
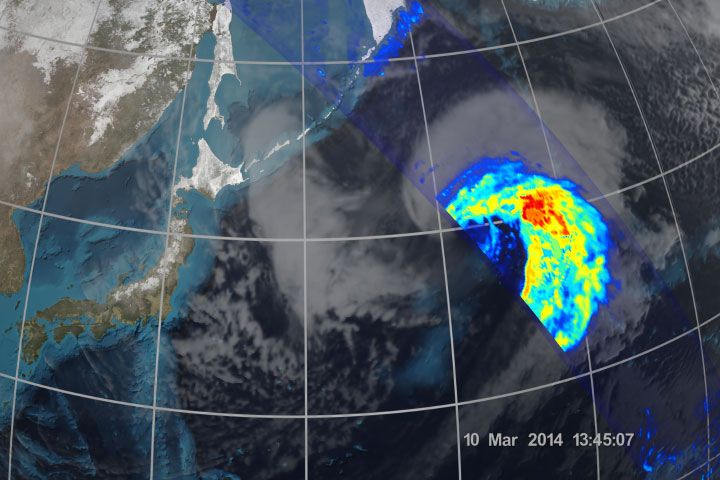
The image above comes from the GPM Microwave Imager (GMI) and shows precipitation across a broad swath of the atmosphere. The colors depict the rain rate; red areas indicate heavy rainfall, while yellow and blue indicate less intense rainfall. The blue areas in the upper left indicate falling snow. GPM has the first satellite sensors specifically designed to measure falling snow and light rainfall.
...
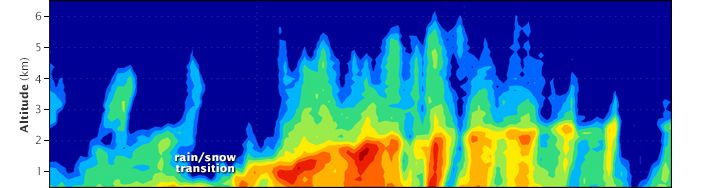
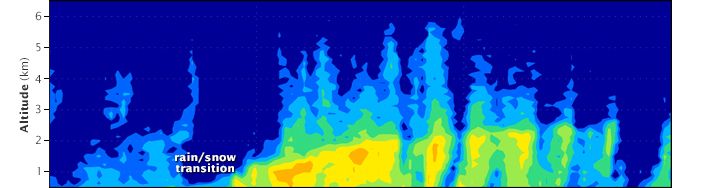
The two images below show a cross-section of the storm from GPM’s Dual-frequency Precipitation Radar (DPR). Heavy to moderate rain is measured by the Ku-band radar frequency, shown in the top image; lighter rain and snow is measured by the Ka-band frequency and shown in the lower image. The left side of the cross-section corresponds with the northwestern edge of the storm. The heaviest precipitation is on the right, which aligns with the high rain rates seen on the south side of the storm in the GMI image.
These radar images provide the first three-dimensional, space-based view of the transition from rain to snow. In the transition zone, the precipitation dips to the ocean surface. Heavier precipitation is to the right (southeast), and snow is to the left (northwest).