Vast geen toeval dat de GD als kouder is ingetekend. 

Meer op:
...
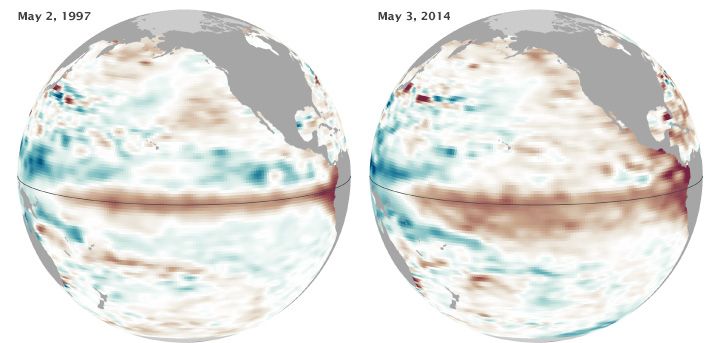
The maps above show the ten-day average of sea surface height centered on May 2, 1997 (left), and May 3, 2014. Shades of red and orange indicate where the water is warmer and above normal sea level. Shades of blue-green show where sea level and temperatures are lower than average. Normal sea-level conditions appear in white. The 1997 map was assembled from data collected by the TOPEX/Poseidon satellite, while the 2014 data comes from the Ocean Surface Topography Mission/Jason 2 satellite.
...
Meer op: