Hi weerwoorders
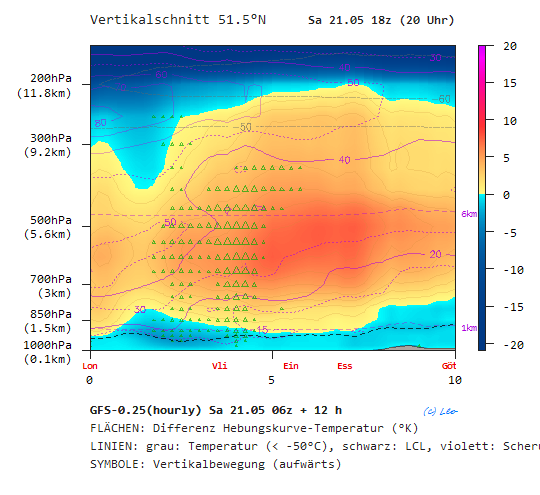
Here is a (experimental) GFS-map for 18z in the evening, showing a vertical cut through the atmosphere, approx. passing through London, Vlissingen, Eindhoven, Essen and Göttingen.
You see quite some CAPE above Brabant plus considerable windhsear (>15kn below 1km, 30 to 40kn below 6km). Moreover some vertical velocity is shown, mainly in the Rotterdam-Antwerp region. Seems that supercells can not be ruled out touday, perhaps accompanied with Tornados (see also the low LCL).
The map also shows the jet above England (high shear values above 300hPa level) and high convective inhibition (dark blue area) accross the sea and above Zeeland.
Hope you can provide some nice pictures if the show starts today (IF it starts at all)!
Best regards,
Leo
Here is a (experimental) GFS-map for 18z in the evening, showing a vertical cut through the atmosphere, approx. passing through London, Vlissingen, Eindhoven, Essen and Göttingen.
You see quite some CAPE above Brabant plus considerable windhsear (>15kn below 1km, 30 to 40kn below 6km). Moreover some vertical velocity is shown, mainly in the Rotterdam-Antwerp region. Seems that supercells can not be ruled out touday, perhaps accompanied with Tornados (see also the low LCL).
The map also shows the jet above England (high shear values above 300hPa level) and high convective inhibition (dark blue area) accross the sea and above Zeeland.
Hope you can provide some nice pictures if the show starts today (IF it starts at all)!
Best regards,
Leo
Bericht laatst bijgewerkt: 21-05-2016 13:54

 .
.