Ha weerwoorders,
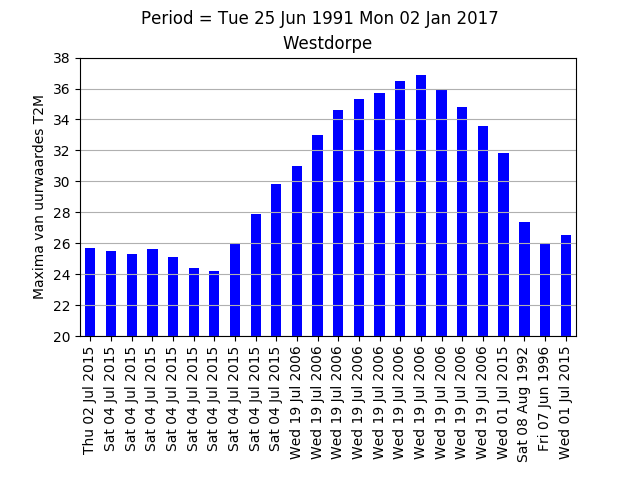
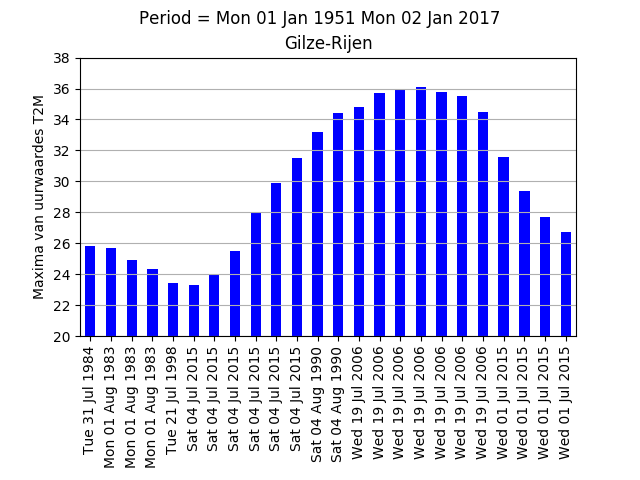
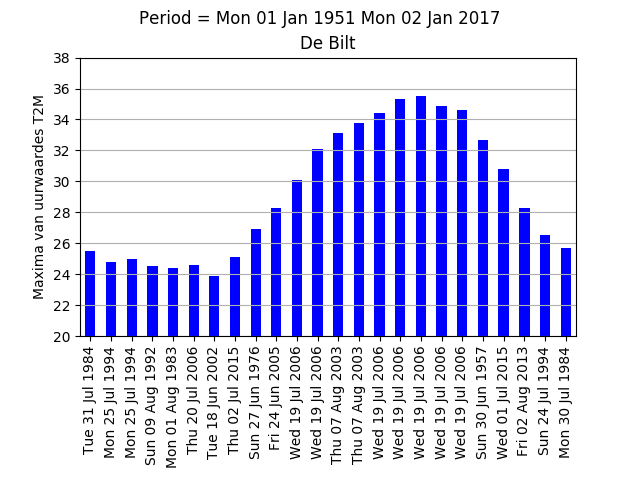
Het leek me leuk om eens aan de slag te gaan met de uurwaardes van het KNMI (beschikbaar tot Jan 2017) die makkelijk te downloaden zijn. Onderstaand het resultaat voor zomaar drie KNMI stations. Voor elke uurwaarde (tijd in UTC) de hoogste twee meter temperatuur, en de bijbehorende dag/datum. De y-as loopt van 00 UTC tot 23 UTC (sorry had geen tijd meer om dit aan t grafiekje toe te voegen). Onderstaand de Python code, mochten er weerwoorders verder mee aan de slag willen (heb zelf geen tijd vandaag, dus go ahead!).
Groeten,
Bas
################################################################################
import pastas # http://pastas.readthedocs.io/
from pastas.read.knmi import KnmiStation
import datetime
import matplotlib.pyplot as plt
stationdict = {
260 : "De Bilt",
350 : "Gilze-Rijen",
319 : "Westdorpe"
}
# Parameters
stationcode = 260
knmi = KnmiStation(stns=stationcode, start='1950', end='2017', interval='hourly',vars='T')
knmi.download()
t2m = knmi.data
t2m = t2m['T']
daily_cycle_max = t2m.groupby(t2m.index.hour).max()
labels = t2m.groupby(t2m.index.hour).idxmax()
mydateformat = '{0:%a %d %b %Y}'
fmt_labels = [mydateformat.format(l) for l in labels]
min_max_ts = [min(t2m.index),max(t2m.index)]
fmt_minmax = [mydateformat.format(l) for l in min_max_ts]
plt.clf()
daily_cycle_max.plot(kind='bar',color='b')
ax = plt.gca()
ax.yaxis.grid(True)
#ax.xaxis.tick_top()
plt.xticks(daily_cycle_max.index,fmt_labels,rotation='vertical')
plt.gcf().subplots_adjust(bottom=0.3)
plt.ylim(20,38)
plt.title(stationdict[stationcode])
plt.suptitle("Period = {} {}".format(fmt_minmax[0],fmt_minmax[1]))
plt.ylabel('Maxima van uurwaardes T2M')
plt.savefig('{0}.png'.format(stationdict[stationcode]))