Analyse op basis van 4 kernpunten winterverwachting Glosea5
Bericht van: sebastiaan (bussum) , 17-10-2019 14:10Deze bijdrage (niet van mijzelf) behandelt vier aspecten die van invloed zijn op de NAO. Zoals beschreven in een artikel van Met Office: ENSO, zeewatertemperatuur Atl. Oceaan, ijsbedekking Kara Zee en QBO.
North Atlantic Oscillation (NAO)
The NAO is a very important teleconnection for UK and European winter prospects. Recent Seasonal Model forecasts point to a positive NAO (+NAO), suggesting the winter outlook for our part of the World is looking to be dominated by cyclonic mild, wet and windy weather.
This post centres on the Met Office paper titled Skillful long?range prediction of European and North American winters and the four key oceanic and atmospheric teleconnections shown to drive or influence the wintertime NAO. You can find the full paper here.
Using the Met Office’s own findings about teleconnection impact I will look at each of them in turn to try and gauge whether their current and forecast state (or phase) supports the recent seasonal forecasts of a positive NAO.
Here’s a key passage from the paper:
“The single most important factor for year to year fluctuations in the seasonal climate around the Atlantic Basin is the state of the North Atlantic Oscillation and its hemispheric equivalent, the Arctic Oscillation. Year to year variability in the NAO describes the state of the Atlantic jet stream and is directly related to near?surface winds and hence winter temperatures (through advection) across North America, Europe, and other regions around the Atlantic Basin. We present estimates of the predictability of the surface NAO and winter climate from the Met Office seasonal forecast system Global Seasonal forecast System 5 (GloSea5) which has high ocean resolution, a comprehensive representation of the stratosphere, and interactive sea ice physics, all of which mediate predictable teleconnections to the North Atlantic.”
For those wishing to learn more about the NAO there's a link to an informative Met Office overview here. There are also a number of other scientific papers relating to the NAO and they can be found in the Learning Area here.
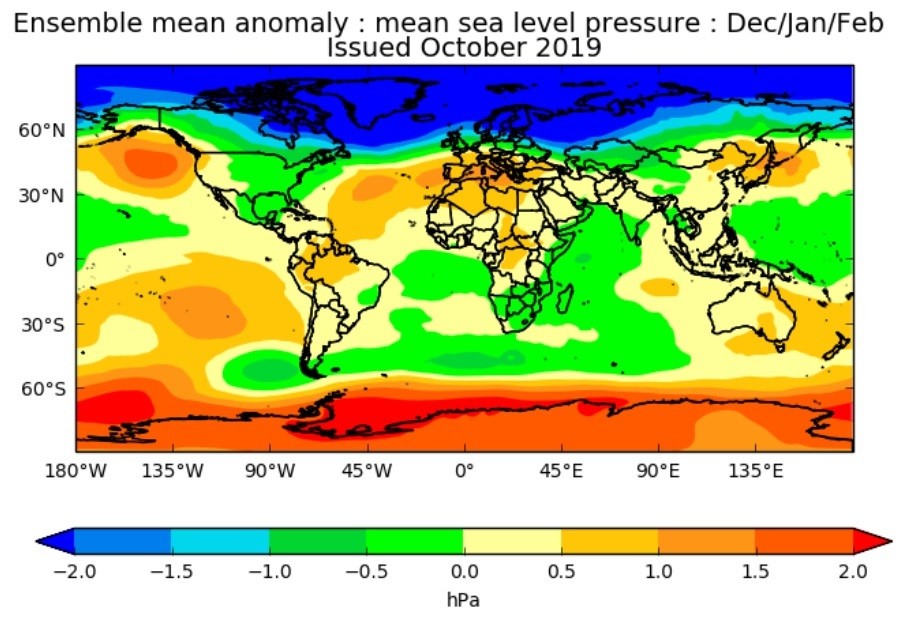
Before looking at the current status of each teleconnection in turn, for reference here’s the latest (Oct 2019) 3-month winter forecast from the Met Office Glosea5 model showing a +NAO:
So which are the four teleconnections used in the Met Office study and which Glosea5 uses when producing its seasonal forecast? (Note: You can find a full list of variables used by Glosea5 here). They are:
- El Nino Southern Oscillation (ENSO),
- North Atlantic Ocean temperatures particularly in the sub-polar gyre,
- Sea-ice levels particularly the Kara Sea,
- Quasi-Biennial Oscillation (QBO).
Focussing in on each:
1. ENSO:
The ENSO state is based on the Oceanic Nino Index (ONI) which measures the departure from normal Sea Surface Temperatures (SSTs) in the ENSO 3.4 Region. El Niño is characterised by a positive ONI greater than or equal to +0.5ºC and La Nina a negative ONI less than or equal to -0.5ºC. To be classified as a full-fledged El Niño or La Niña episode, these thresholds must be exceeded for a period of at least 5 consecutive overlapping 3-month seasons.
The Met Office paper states:
“One source of predictability originates in the tropical Pacific. Previous studies have shown that the El Niño–Southern Oscillation [based on 3.4 Region] can drive interannual variations in the NAO and hence Atlantic and European winter climate via the stratosphere. …… this teleconnection to the tropical Pacific is active in our experiments, with forecasts initialized in El Niño/La Niña conditions in November tending to be followed by negative/positive NAO conditions in winter.”
The latest 16th October ENSO update from NOAA confirms that ENSO is currently neutral, as defined above, but interestingly that over the next month will be close to the El Nino threshold and that their multi-model forecasts also keeping ENSO close to the threshold over the winter:

In their analysis NOAA say:
“Many dynamical forecast models, including the NCEP CFSv2, suggest Niño-3.4 SST index values will remain near +0.5°C during the next month or so before decreasing, but remaining above zero.”
And over the winter months:
“…….with multi-model [forecast] averages of Niño-3.4 values remaining close to El Niño thresholds (+0.5ºC).”
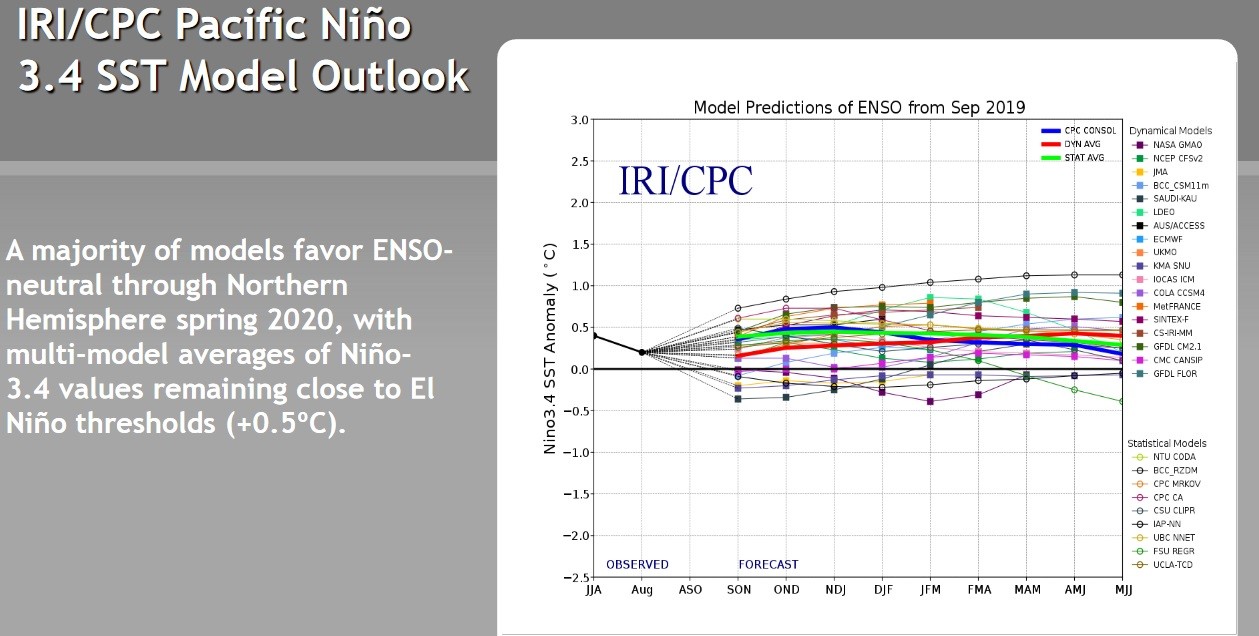
My conclusion: Current and forecast ENSO conditions, whilst neutral (based on official classification), are closer to El Nino than La Nina and do not appear to be in support of the Glosea5 forecast. It could be argued they appear more favourable to supporting a negative rather than a positive NAO.
2. North Atlantic Ocean temperatures particularly in the sub-polar gyre
Next a look at the second teleconnection of importance. The Met Office paper states:
“……by selecting forecasts in years with a warm or cold north Atlantic subpolar gyre in November, we can examine the resulting winter signal in the atmospheric circulation. Forecasts starting from cold/warm North Atlantic states also result in winter predictions with more positive/negative NAO.”
The Met Office use the North Atlantic ocean heat content (OHC) averaged over 90W-0E, 50-60N and the upper 500m of the ocean and use one of their internal models to obtain this data. I’ve not been able to obtain publicly available information that exactly matches their criteria, but instead have used the current SSTs for the area and a sub-set of the area that does have Argo OHC data averaged down to 800m.
SSTs with Met Office area marked in red:
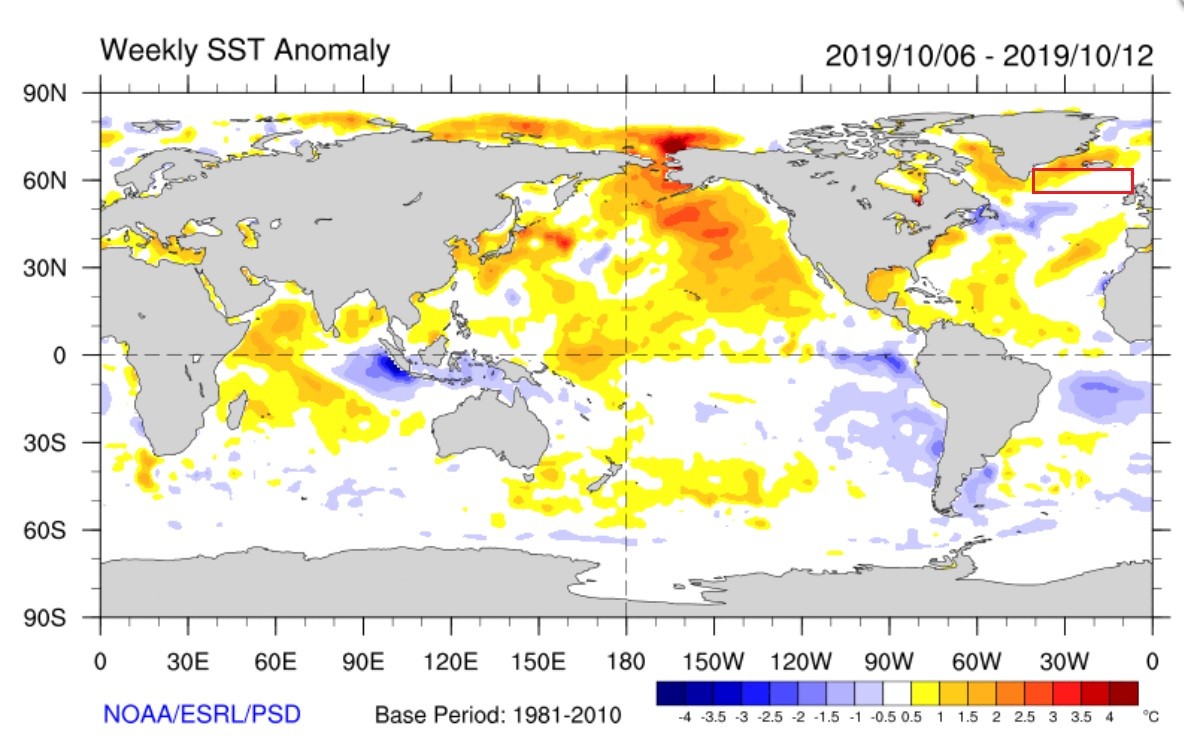
Source: https://www.esrl.noaa.gov/psd/map/clim/sst.shtml
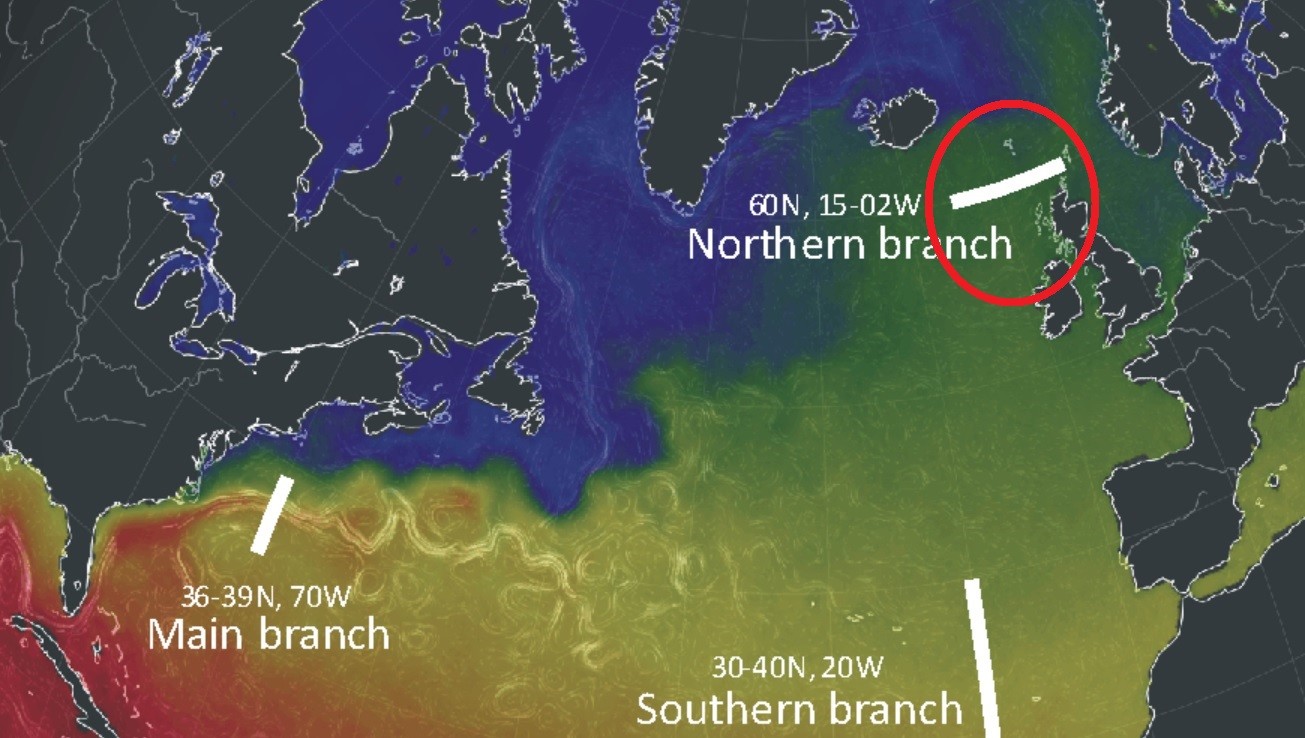
Sub-set of OHC for area (data is only available for the following area shown on this map as the Northern Branch of the Gulf Stream):
And here’s the latest available data for March 2019 with my estimate of the likely trend, based on previous years fluctuations, marked in red:

My conclusion: Using the above substitutes in the absence of Met Office figures is inclusive. SSTs are neutral whilst the average of the 0-800m temps of a sub-set of the area ‘might’ be trending colder which if so would be supportive of a positive NAO.
3. Arctic Sea-Ice (Kara Sea)
The third teleconnection influencing the NAO is the level of Arctic sea ice, particularly in the Kara Sea to the north of Europe. The Met Office paper states:
“Interannual variability of sea ice and hence surface temperature is large here and has previously been connected to the generation of large?scale circulation anomalies. [The research shows] the association between sea ice anomalies in this region [45-75E, 67-80N] in November and the subsequent winter circulation in forecasts and observations. As identified….. low/high sea ice concentrations in the Kara Sea in November precede negative/positive NAO anomalies, with anomalous pressure gradients over northernmost Europe and the East Atlantic.”
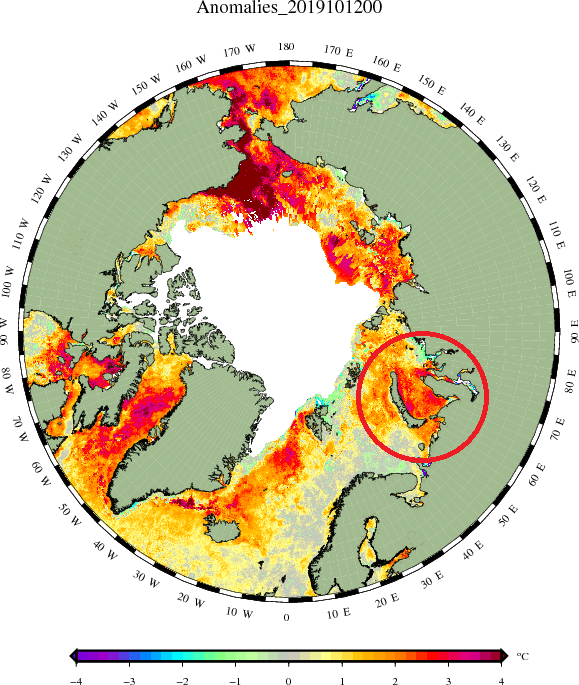
Here are the current SST conditions in the area on the 12th October. The Kara Sea is circled in red and SSTs are 2C to 3C above the long-term average for the time of year:
Source: http://ocean.dmi.dk/satellite/index.uk.php
A look at current sea ice cover in the Arctic also shows that extent is well short of the 1981-2010 long-term average:

My conclusion: If these conditions were to persist into November, this teleconnection would be supportive of a negative NAO. Clearly an update on the status of this teleconnection is required as we move into November.
4. Quasi-biennial Oscillation (QBO)
Our final teleconnection influencing the NAO arises from the phase of the quasi?biennial oscillation (QBO) in the tropical lower stratosphere. Basic info on the QBO can be found here. The Met Office paper states:
“Interannual variability between westerly and easterly phases of the QBO [at 30hPa] has long been known to influence the troposphere in the Atlantic sector….. with westerly QBO being associated with a stronger extratropical jet, particularly in early winter.”
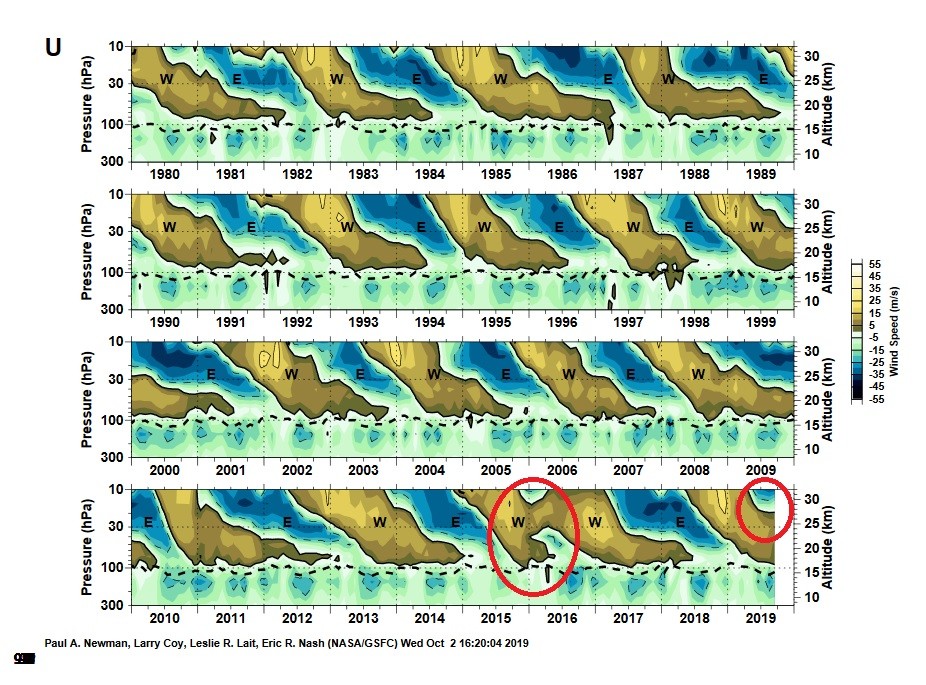
At the moment the easterly QBO zonal winds are slowly descending but for the last several weeks have stalled somewhat at 20hPa. This is illustrated on the latest chart from the NASA website with the small circle in red. For interest I have circled the unique eQBO of 2016 that failed to descend and reverted to wQBO.
Source: https://acd-ext.gsfc.nasa.gov/Data_services/met/qbo/qbo.html#intro
Extrapolating the latest NOAA 30mb QBO data from Jan to Sept 2019 suggests the QBO at 30mb won’t turn easterly until Feb 2020.
Monthly data: 9.02 9.25 11.82 13.36 14.59 14.36 10.96 9.97 8.25
However, in a June 2018 paper titled: Surface impacts of the Quasi Biennial Oscillation (full paper here) it was found that
“…..in early winter (December), responses to the QBO show maximum sensitivity at ∼20 hPa, but are relatively insensitive to the QBO winds below this until late winter. The impact is that Atlantic/European response is shifted eastward compared with the normal +NAO pattern.”
My conclusion: The influence of the present westerly QBO will be waning as the easterly zonal winds descend. But possibly more important, if the research mentioned above is taken literally, then the early winter surface response to the QBO shows maximum sensitivity to what’s happening in the stratosphere at around 20hPa, which is already easterly. It could therefore be argued that this teleconnection is supportive of a negative NAO.
Summary
Whilst the publicly available data used in my analysis is clearly going to be somewhat unsophisticated when compared with the comprehensive input data that Glosea5 would use, I nevertheless find it interesting that the current and forecast state of key teleconnections may not be completely in agreement with forecasts of a positive NAO as we go into winter. I’ll revisit the status of the four teleconnections again in November to check for any developments.