Ik vind de onderstaande uitleg van de MJO duidelijk en informatief. Hij komt van David. Topvent. http://www.netweather.tv/forum/topic/92605-teleconnections-interactions-and-impact/?do=findComment&comment=4101568
The Madden-Julian Oscillation (MJO)
A look at what the MJO is currently doing and forecasts going forward. But first a quick overview of the MJO and how it can impact the UK for those wishing to learn.
The MJO is an intra-seasonal (possible multiple events each season) tropical phenomenon in which a disturbance of clouds, rainfall, winds, and pressure travels east around the planet following the line of the equator, returning to its initial starting point in 30 to 60 days on average.
The tropical disturbances that represent an active MJO create equatorial Kelvin and Rossby waves as the surface pressure, heavy precipitation and subsequent condensation releases (latent) heat into the atmosphere. The key generation area for Kelvin-Rossby waves is roughly from 120E to 120W. The following charts represent a NWP model of the atmosphere and show the equatorial Kelvin-Rossby wave response as it propagates eastwards:
Response Day 1: 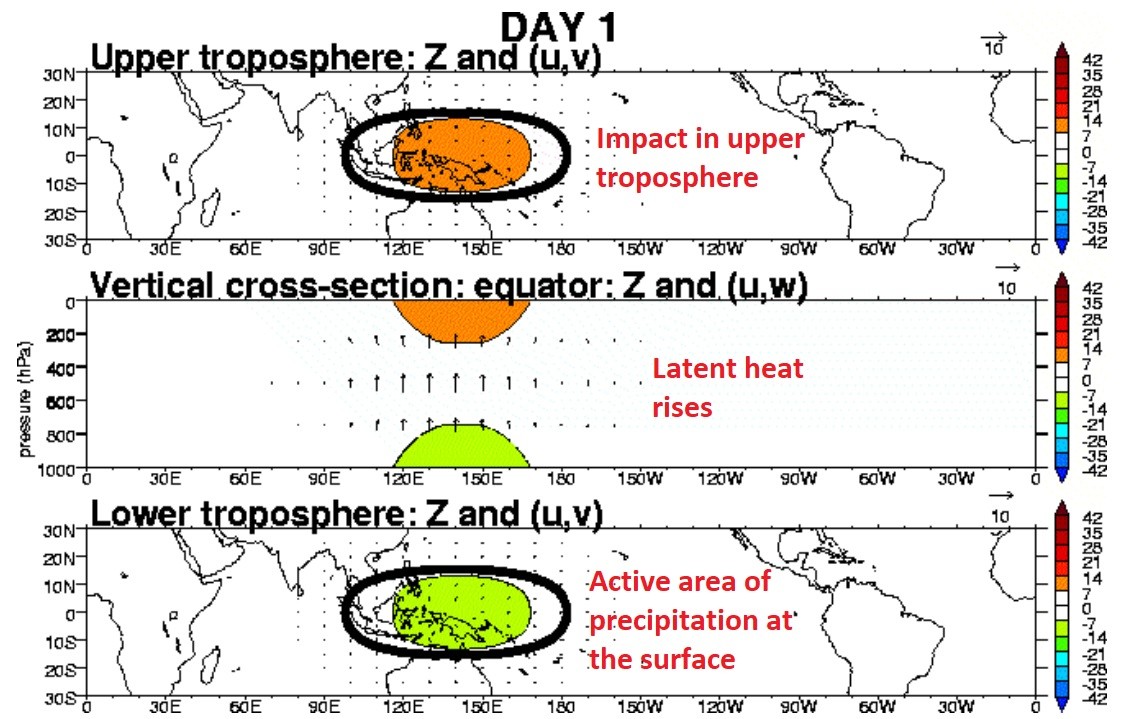 Response by Day 25:
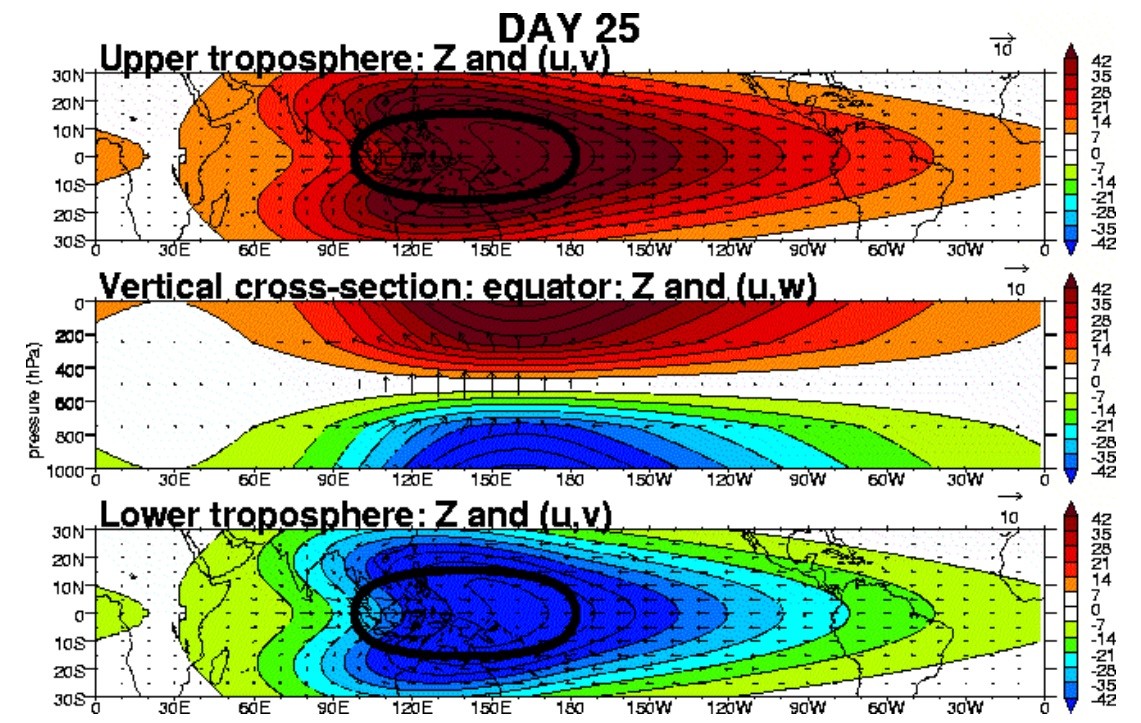
The MJO makes a large contribution to various weather events in the mid-latitudes when in different phases. And certain Phases can also impact what happens in the stratosphere.
“It is clear that phases 7 and 8 are preferred during the 12 days preceding Sudden Stratopheric Warmings (SSW). During days 13 to 24 before SSWs, MJO phases 4, 6, and 7 are preferred, while during days 25 to 36 before SSWs, MJO phases 2 and 3 are preferred.”
Source: Observed connection between stratospheric sudden warmings and the Madden-Julian Oscillation
The progress of the MJO around the globe can be followed through the Phase diagram updated regularly by NOAA and other organisations. Here’s the GEFS forecast showing the location of the MJO from Oct through Nov and into early Dec. Each point on the chart is the date. The green is the forecast period and the MJO is shown to be imminently heading into the COD (circle of death) resulting in little continued influence on the mid-latitudes. The further away from the COD, the stronger the MJO.
Source: https://www.cpc.ncep.noaa.gov/products/precip/CWlink/MJO/CLIVAR/clivar_wh.shtml
Phases 8 and 1 are when the MJO can exert its most impact on UK weather, as illustrated by the following annotated Sea Level Pressure charts for Phase 8 and Phase 3 - 4.
Phase 8 suggesting support for a negative NAO: 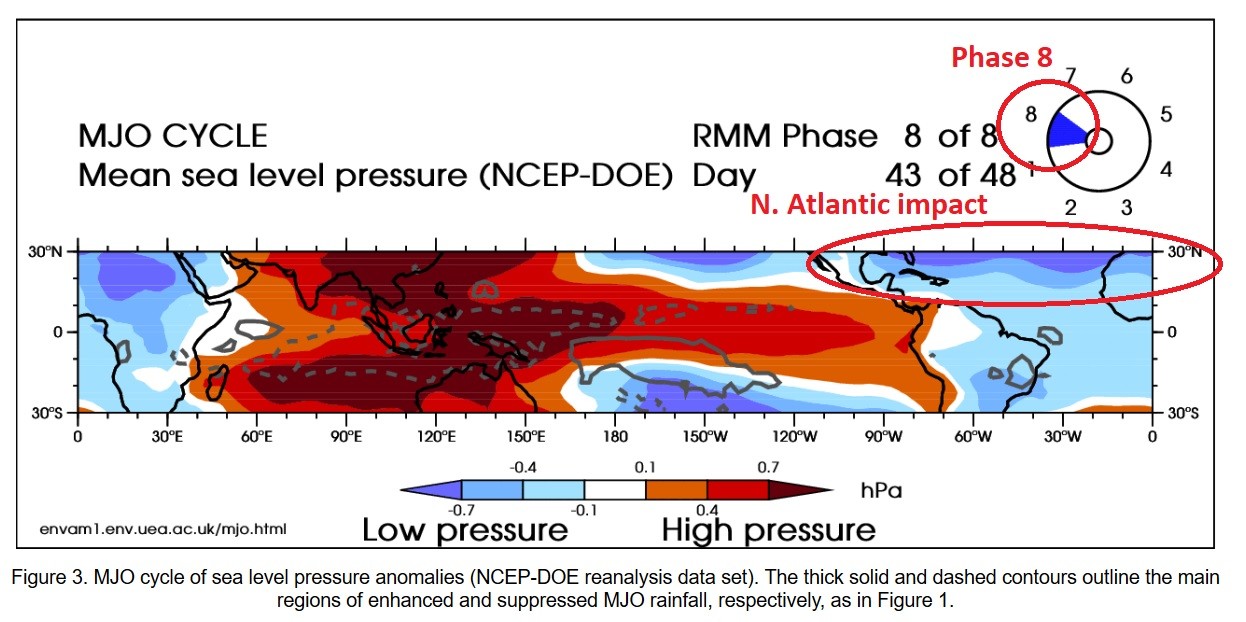
Phase 3 – 4 suggesting support for a positive NAO: 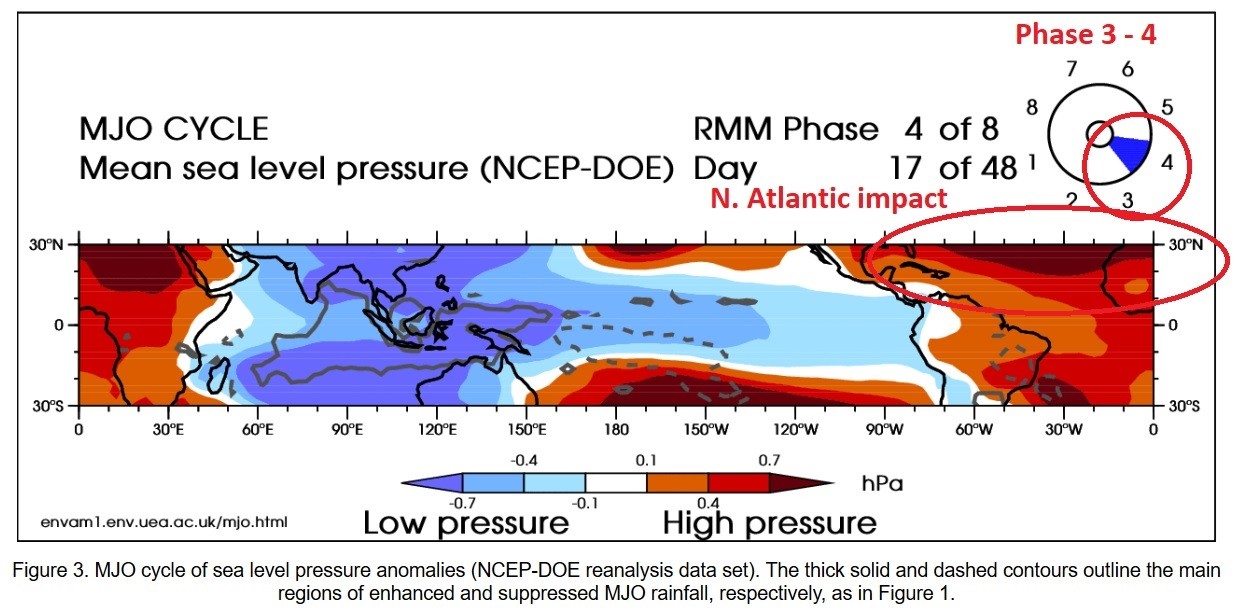
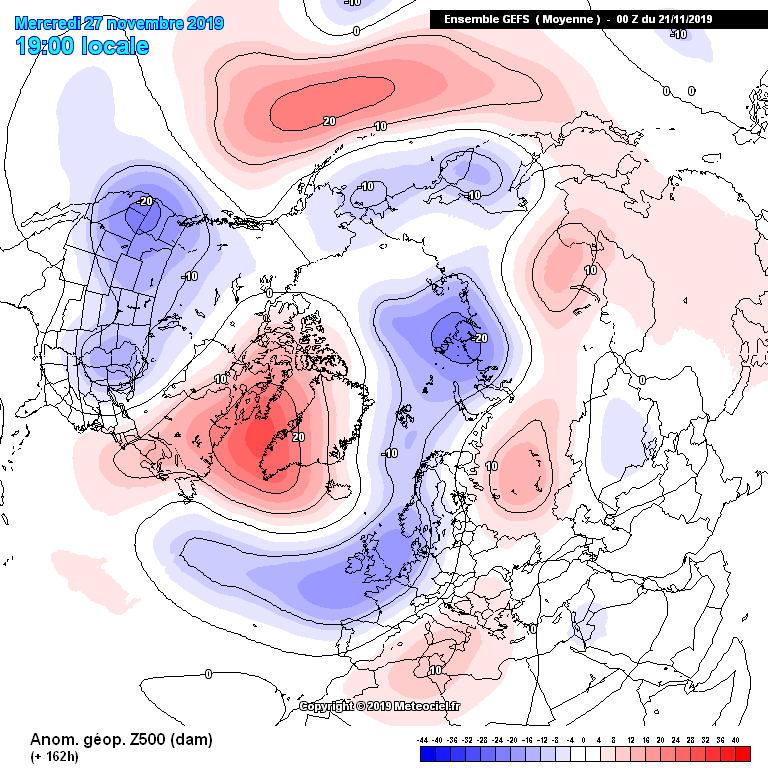
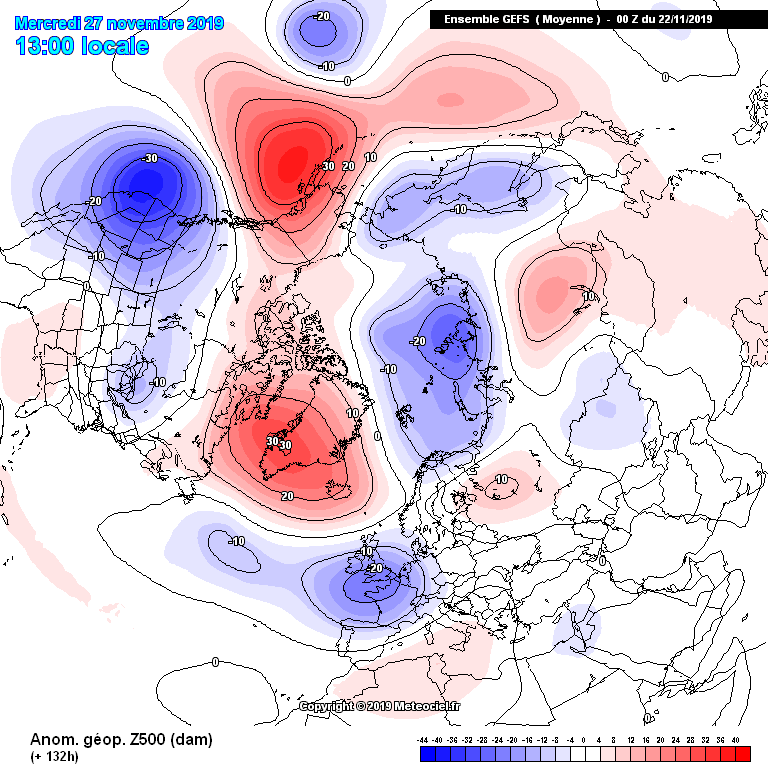
There are also composite 500hPa geopotential height anomaly charts available that have been built up from past MJO activity and show the typical tropospheric synoptic pattern for each Phase. (A note of caution here – Arctic Warming may now be impacting on previously expected patterns so composites should be viewed accordingly). Variants are available for different phases of ENSO, so with ENSO currently neutral here’s the composite chart for Phase 1 in November, and for comparison and out of interest, the GEFS Mean 500hPa Anomaly for 27th Nov from 21st and 22nd Nov:
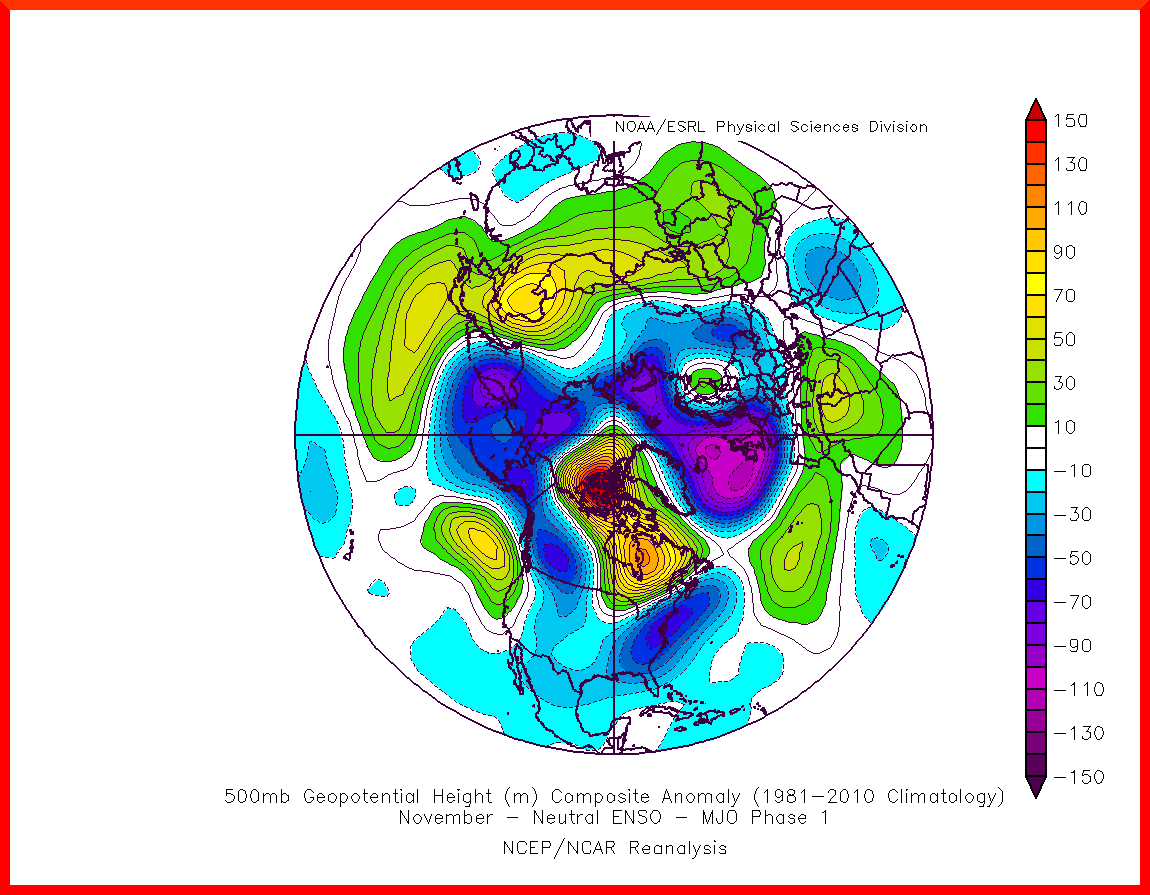
Source Composite chart: https://www.meteonetwork.it/models/mjo/
Source GEFS anomalies: http://www.meteociel.fr/modeles/gefs_cartes.php?code=21&ech=132&mode=5&carte=1
The MJO forecast going forward into December
The following chart shows Outgoing Longwave Radiation (OLR) which represents the differing reflection levels given off by a cloudy or clear sky. Here the brown shading indicates clear skies and dry weather (MJO inactive), with green indicating cloudy skies and wetness (MJO active). The active MJO is shown within the solid black line area, with the inactive MJO area within the dotted black line area. We can see the current MJO activity over the Kelvin-Rossby wave generation area drawing to a close during late November. However, in the forecast area of the chart the next event (strong greens) is getting going in the Indian Ocean and, as indicated by the solid black line area, is set to move into the KW generation area later into December.
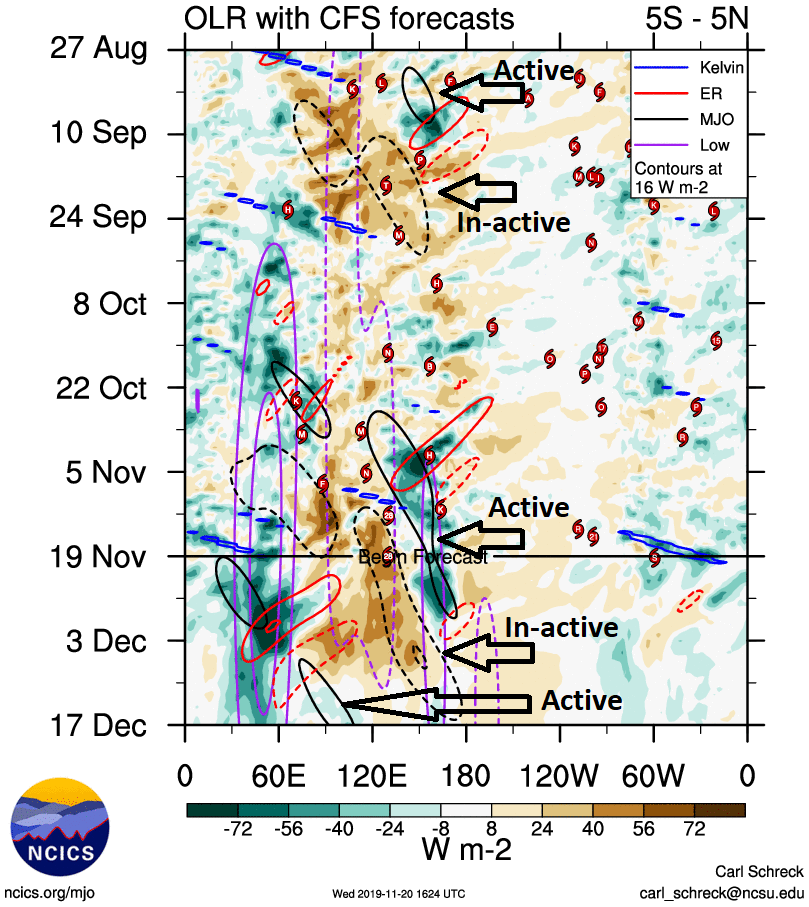
Source: Climate Forecast System (CFS) https://ncics.org/portfolio/monitor/mjo/
The CFS 200hPa Velocity Potential Empirical Wave Propagation forecast uses upper atmosphere dynamics to forecast the potential for precipitation for the next 40 days. Here’s the latest output for 20th Nov to 30th Dec with the red anomalies indicating drier/inactive phase (no support for precipitation) and green supportive of moisture and convection thus precipitation/active phase. Each box represents a 5-day forecast period. Again we can see as November draws to a close a new Phase of MJO activity is building in the Indian Ocean. This crosses the mid-Pacific around the middle of December but not moving towards the west-Pacific and favourable Phases 8 and 1 for UK impact until towards the end of December.
Source: http://www.daculaweather.com/4_mjo_phase_forecast.php