Predicting mid-latitude weather in summer can be more of a challenge than in winter. This is generally because components of the atmosphere-ocean system which provide predictability during winter aren’t present in summer: we don’t have fully developed El Niño-Southern Oscillation episodes; there’s no stratospheric polar vortex; the Madden-Julian Oscillation tends to be less active; and mid-latitude jets are weaker and don’t carry signals quite as well around the globe. I’d also suggest that — at least from my experience in the UK — the public are more interested in whether it will be dry or wet, rather than warm or cold, which can be a challenge given the significant contribution of convective rain in summer.
What I will present in this blog is not a personal forecast. Instead, I’ll discuss some summertime dynamics and then look at what the forecasts from the May update to the C3S seasonal forecast database show in terms of the large-scale circulation over the Euro-Atlantic region. As of this month, we now have forecasts from eight different modelling centres: ECMWF, the Met Office (UKMO), Météo-France, Deutscher Wetterdienst (DWD), the Euro-Mediterranean Center on Climate Change (CMCC), the National Centers for Environmental Prediction (NCEP), the Japan Meteorological Agency (JMA) and the newly-added Environment and Climate Change Canada (ECCC).
Modes of variability
The seasonal cycle of the eddy-driven (polar) jet latitude and strength means that the leading modes of variability (or Empirical Orthogonal Functions, EOFs) in the North Atlantic during summer are slightly different to those during the winter. This means that the North Atlantic Oscillation (NAO) should be considered as a seasonally-varying phenomenon. The indices produced by the Climate Prediction Center, for example, account for this aspect.
Let’s consider ERA5 monthly-averaged mean sea-level pressure (MSLP) over 1979-2020 in the domain 40-70°N, 90°W-30°E. The leading EOF (Figure 1, top left) looks like the NAO but is more tilted, with a centre of action extending northeast towards the UK and Ireland and the Icelandic centre shifted further west to Greenland. This is the “summer NAO” or SNAO (Folland et al. (2009) — although to be specific, they considered July-August only, where the extension toward northwest Europe is even more pronounced).
I’m a fan of always considering more than just the leading EOF, so let’s also look at EOF2 (Figure 1, top-right). This is characterised by a circular centre of action just west of Ireland. Wulff et al. (2017) call this the “summer East Atlantic” (SEA) pattern [although to be specific they use 500 hPa heights, but it’s a vertically deep phenomenon]. Note that sometimes the SEA is defined with the opposite sign to that shown here.
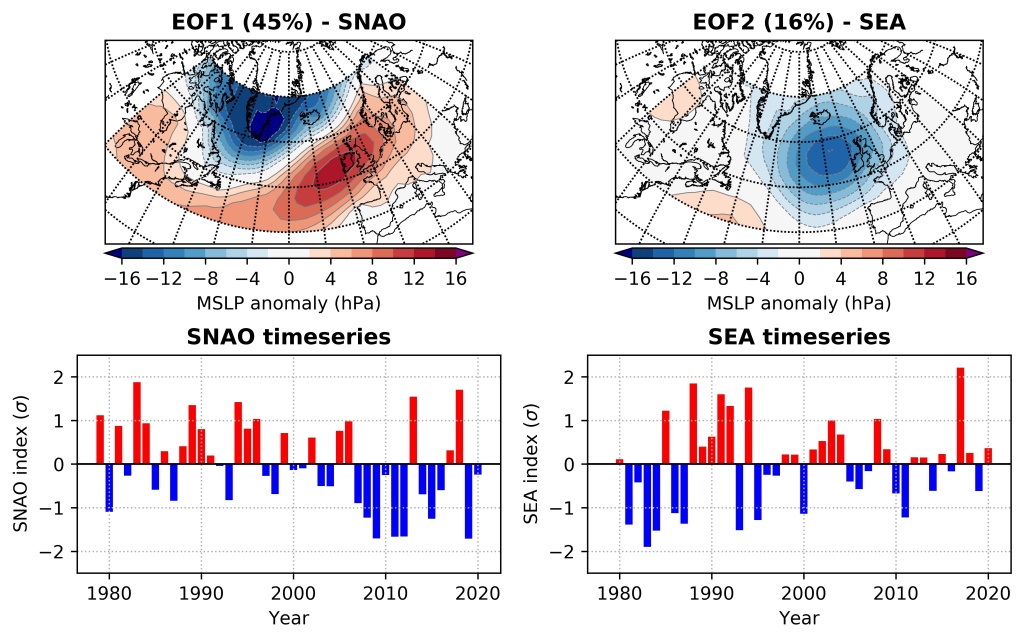
Together these two EOFs explain 61% of the variability in the June-August monthly-mean MSLP anomalies in this domain, so we’ve got most of the large scale picture sorted with just these two. Note that I haven’t detrended the MSLP anomalies — it makes a slight difference, but not enough to hugely alter the main conclusions here.
Timeseries of the standardised loadings of the SNAO and SEA are shown in the bottom two panels of Figure 1. For the SNAO, three strongly positive years are 1983, 2013 and 2018, which were all very warm and sunny in the UK. There are also a string of negative years from 2007-2012, which were five consecutive wetter and cooler summers. It also appears that the SNAO has been more dominantly negative since 2007. For the SEA, it’s been of generally low amplitude since 2000, with only 2011 (negative) and 2017 (positive) exceeding 1 standard deviation.
How do these modes relate to real weather?
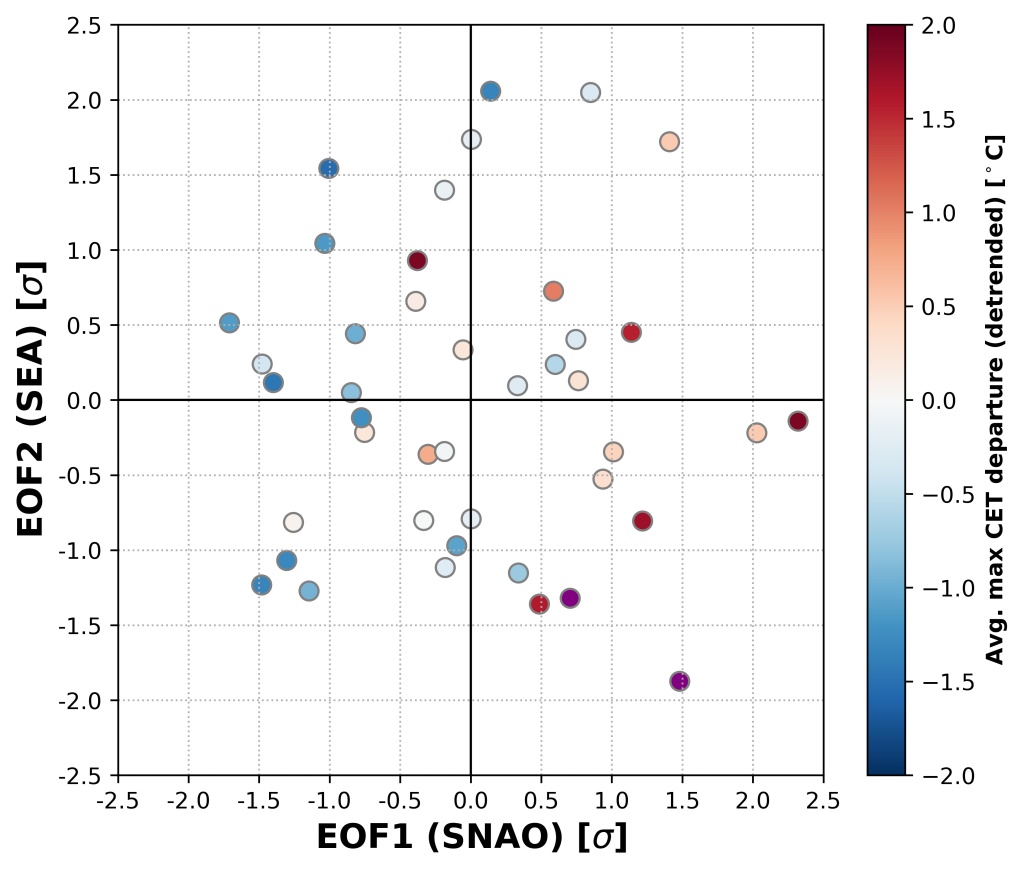
I really like the 2D EOF-space diagrams produced by ECMWF (see also Ferranti et al. (2018)). So here’s an equivalent for the SNAO and SEA over 1979-2020 (Figure 2), with each data point coloured by the linearly-detrended average-maximum Central England Temperature (CET). It’s readily apparent that warmer summers feature a +SNAO, but that the warmest summers tend to be +SNAO and -SEA. Examples of positive SNAO-negative SEA summers include 2018, 2006, 1995 and 1983, which are all quite legendary in the UK. The only very warm summer with the opposite pattern (negative SNAO and positive SEA) is 2003.
To that end, the observed conditional probability of a warmer-than-average summer given a negative SEA and positive SNAO is 0.8. That compares with 0.4 for a positive SNAO and positive SEA, and only 0.27 for either of the SEA phases with a negative SNAO. Likewise, the coldest summers are negative SNAO-positive SEA combinations.
We can do the same thing with precipitation (Figure 3). For consistency with the temperature data, I’ve used the Central England Precipitation (CEP) and also linearly detrended the data. A similar result emerges: the driest summers are those with a +SNAO, but especially those with a +SNAO -SEA. However, the SEA has less of a well-defined precipitation signature, with wet summers scattered across both phases of the SEA when the SNAO is negative.

Plotting hypothetical fields for each of these quadrants (Figure 4) — with the SNAO and SEA set to +/-1 standard deviations — it’s easy to see why the SNAO+ SEA- combination yields the warmest summers on the CET, with the strongest anomalous Azores ridge extension. It’s also easy to see why wet summers can happen regardless of the SEA phase so long as the SNAO is negative.

What do the forecasts this year show?
I downloaded the monthly-averaged pre-processed anomalies from C3S, so all model data are with respect to the same base period of 1993-2016. I then projected these data onto the two EOFs above to get a loading value. There are caveats to this: we don’t necessarily know that the model EOFs are the same as the real world EOFs, and it’s also not a trivial task to best normalise the loading (I’d need to pull the hindcast dataset).
But it gives a rough idea (and this is only a blog, after all).
The boxplots in Figure 5 show the ensemble distribution of the May predictions for the SNAO and SEA in summer 2021, with green triangles denoting the mean and orange lines the median.

If we consider just the average, then all are predicting a +SNAO except the Met Office (although the average anomaly in that system is very small anyway) and most are predicting a -SEA except DWD, JMA and ECCC. So, there seems to be a signal for the +SNAO -SEA combination, which would suggest an increased chance of a warmer and drier summer in the UK (at least).
I then split each ensemble into each quadrant of the 2D-EOF space to get an idea of the intra-model spread (Figure 6). It turns out these appear to be very uncertain, except for ECMWF — which has a strong signal for the +SNAO -SEA combination (53% of ensemble members). Six prediction systems have most of their ensemble members predicting a +SNAO, tied between both phases of the SEA.

While this isn’t a strong suggestion of the warmest of the four categories, it’s not a prediction of something absolutely atrocious like the 2007-2012 period. That’s got to be good news, right?* It also suggests quite a change from the current prolonged Greenland blocking which has led to an unusually cold spring in the UK. But it could be that all these forecasts are wrong – it happens, but then we’d want to know why (I firmly believe there is no such thing as a useless forecast from a science perspective).
Concluding thoughts
It would be interesting (but beyond what I have the time to do) to analyse the relationship between these different forecasts and the precipitation in the tropics. Wulff et al. (2017) related the SEA pattern to the onset of ENSO events modulated via the Pacific-Caribbean precipitation dipole. It may be the case that uncertainty in this Rossby wave source (as we move out of La Niña) is projecting onto uncertainty in the SEA predictions in particular.
Some thoughts on summer 2021 – Simon Lee (simonleewx.com)
Simon Lee: Atmospheric scientist. PhD candidate. Stratosphere-troposphere coupling, S2S prediction, climate dynamics. Co-Editor in Chief @RMetS Weather.