Predictability of European Winters 2017/2018 and 2018/2019: Contrasting influences from the Tropics and stratosphere - Knight - 2021 - Atmospheric Science Letters - Wiley Online Library
3.3 Tropical forcing of the February 2018 SSW
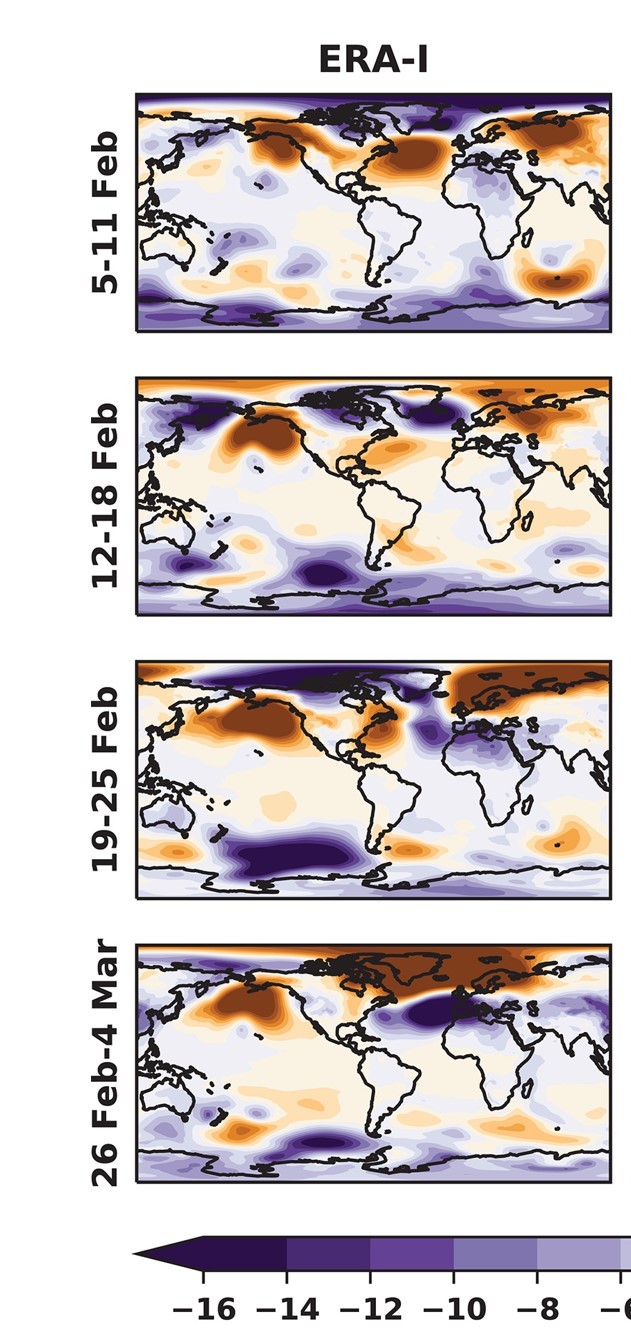
The strong tropospheric wave 2 pattern in the top left panel of Figure 3 was responsible for the SSW in February 2018 (Lü et al., 2020). We showed above that this pattern originated in part from tropical influences. Pacific PMSL patterns leading up to the event are indicative of Rossby wave propagation generated by tropical sources. This process is familiar as the means by which the winter climatological Aleutian cyclone deepens and fills in response to El Niño and La Niña, respectively (Yeh et al., 2018). Despite consistent La Niña conditions in winter 2017–18 (each winter month had a Niño 3.4 amplitude of just below 1 K), the positive North Pacific PMSL anomaly was strongest in February. Additional forcing came from a very strong Madden-Julian Oscillation (MJO) cycle that developed in January 2018 and propagated into the Pacific towards the end of that month. The MJO has been shown to increase the likelihood of both the development of SSWs (Garfinkel et al., 2012) and the negative phase of the NAO (Cassou, 2008) after it has passed into the tropical Pacific. In particular, phases 6 and 7 of the MJO (Wheeler and Hendon, 2004) are linked with tropospheric ridging in the northeast Pacific as a result of production of Rossby waves in response to MJO's large-scale convective anomalies. The SSW event of January 2009 has been linked to the MJO via similar extratropical circulation patterns (Schneidereit et al., 2017), although MJO activity in 2009 was not as extreme as in early 2018. As in most prediction systems, the MJO in GloSea5 is not predictable beyond the sub-seasonal timescale (Lim et al., 2018) and was not predicted by the GloSea5 forecasts discussed here.
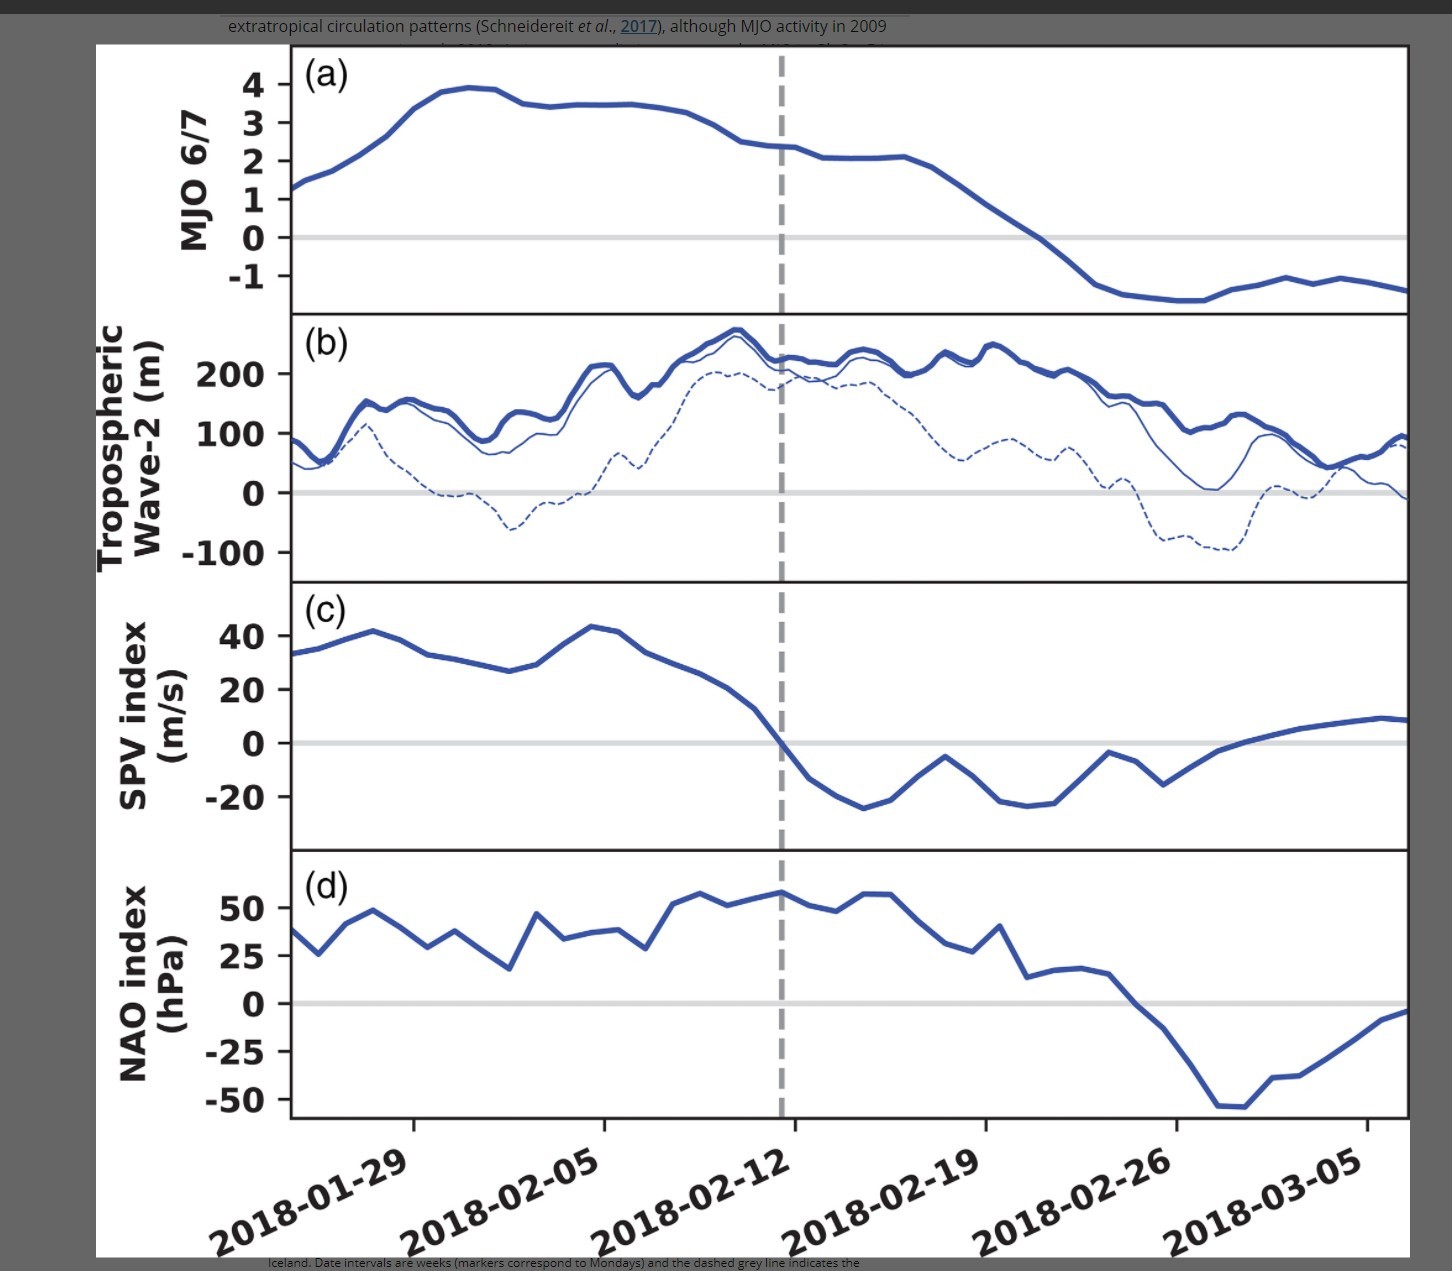
In late January 2018, the MJO's projection onto phases 6 and 7 grew very strong (Figure 4, upper panel). It remained strong (if not at peak strength) until mid-February. It is during the time MJO phase 6/7 was strong that positive North Pacific PMSL anomalies appeared. In agreement with this, the amplitude of the tropospheric wave 2 started to increase at the beginning of February (Figure 4, second panel). This is several days after the growth of MJO phase 6/7, as expected for Rossby wave propagation to the extratropics (Jin and Hoskins, 1995). A peak amplitude of over 250 m was reached in the second week of February. A positive node of wave 2 was very well aligned with the location of Pacific anticyclonic anomaly throughout the time it had a high amplitude (Figure 4, second panel). The blocking over Eurasia was generally much less well aligned with wave 2, however, except for a period of about a week from 7th February (Figure 4, second panel). This suggests that the wave 2 forcing was initially a result of the Pacific anticyclonic anomaly, but that a blocking event subsequently developed over Eurasia, acting to intensify it.
The polar vortex started to weaken at the end of the first week of February (Figure 4, third panel). This is before the Eurasian anomalies were contributing to wave 2 (note wave 1 was not particularly strong at this time), suggesting that the initial vortex weakening is a result of the Pacific anomaly. Following consistently elevated wave 2 forcing, the vortex undergoes a split-type SSW on 11th February. Zonal mean winds remained easterly until the start of March, allowing a lengthy window of influence on the troposphere. Following downward propagation of the SSW signal, the NAO index started to decline soon after mid-month and became strongly negative (~ −50 hPa) by the last few days of February (Figure 4, lower panel), implying intense easterly flow over Europe. Note that despite imposing the large MJO event in the tropical relaxation ensemble, the model does not reproduce the SSW. As highlighted above, its North Pacific response is too weak and it possesses little of the Eurasian signal. This means its wave 2 forcing is too small to consistently trigger an SSW in its members.
-----------------
Paul, bedankt voor je opm. Ik heb nog steeds geen tijd gehad om me in de PDO te verdiepen. Het getoonde onderzoek laat m.i. een vrij standaard La Nina patroon zien voor januari en februari. Gecombineerd met een sterke strato. poolwervel. In het verhaal zie je ook de problemen voor de winterverwachting ivm MJO niet lang vooruit te voorspellen is.