De opdringerigheid van het Iberisch Hoog in beeld gebracht
Bericht van: Jaimy (Hulsberg) , 04-01-2025 17:02Het gewaardeerde lid WYorksWeather op het Netweather forum heeft recent (18 december) een kleinschalig onderzoekje gepost waarin hij heeft gekeken naar hoe de winterse drukpatronen in Europa zich verhouden tot het gemiddelde van 1991-2020. Een statisticus mag uitleggen of dit enige significantie betreft, maar ik vond het vooral een bevestiging van wat ik en velen onder ons al dachten naar aanleiding van de afgelopen zoveel winters en in mijn geval ook het bestuderen van vele reanalyse kaarten. Ik wil dit graag met jullie delen, omdat ik het toch wel als belangrijk beschouw en benieuwd ben naar jullie gedachten hierover. Ik citeer:
"Thought it might be of interest with reference to Euro heights to see how much more common these are than in years past. To test this I've created a few charts using the NCAR/NCEP re-analysis tool.
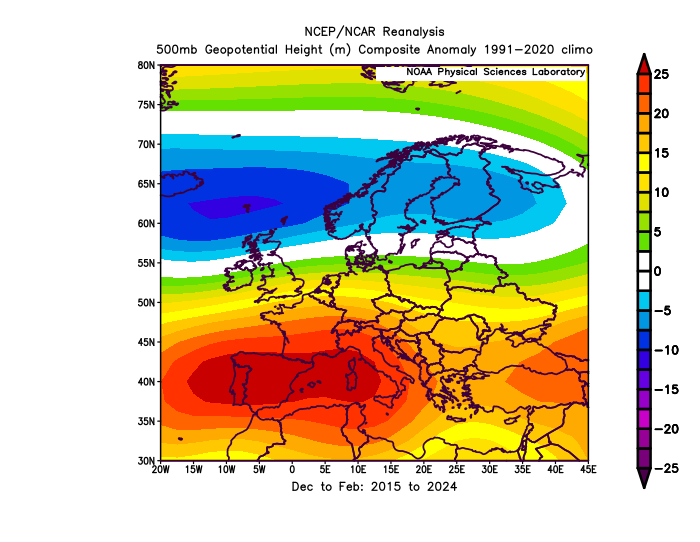
These are 500mb height anomalies for winters compared to the 1991-2020 average. Starting with the most recent 10 winters, you can see an anomaly of about 25m (2.5dam) centred over Iberia for 2015-2024 (we mean the ending year of the winter here, so 2024 is winter 2023-24).
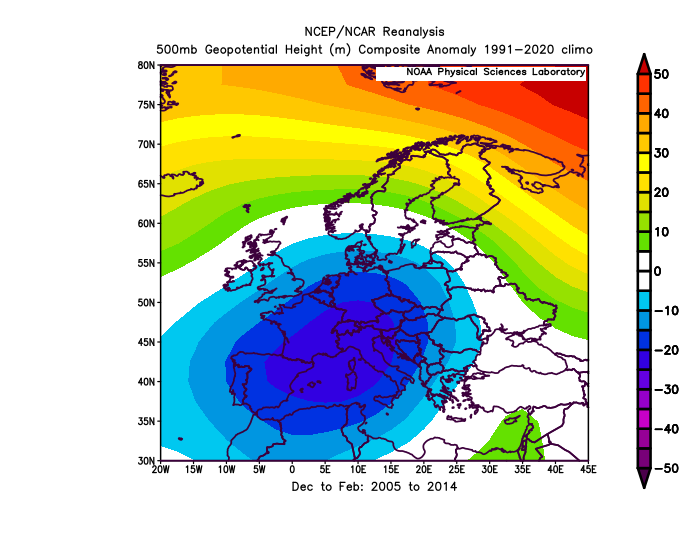
What happens if we go further back? Here is 2005-2014, which included a number of colder winters. Actually a strong negative anomaly over Europe - around -30m (3dam).
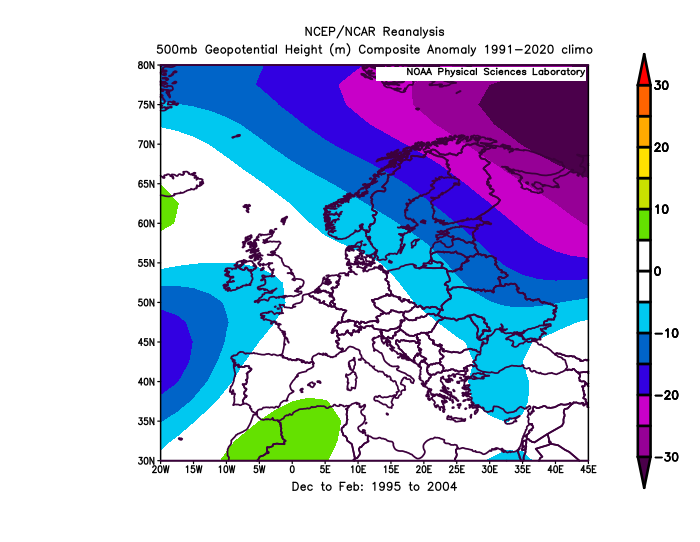
Another 10 years back. No real signal for 1995-2004.
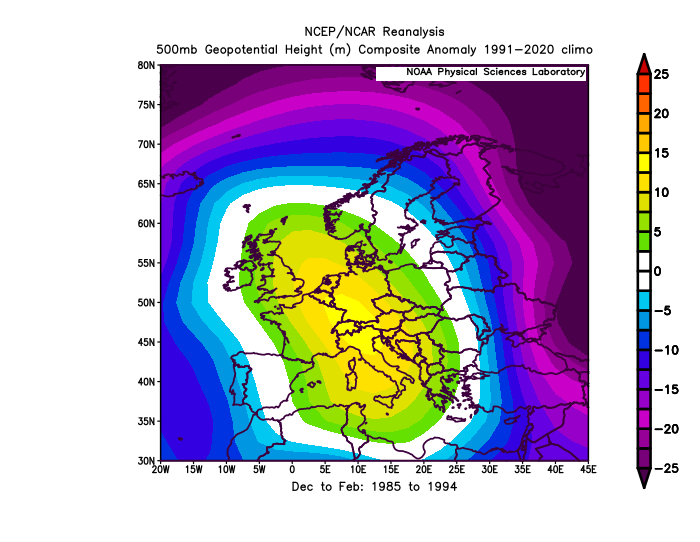
1985-1994. This included some mild late 80s winters, but again only an anomaly of 10-15m (1-1.5dam) relative to 1991-2020, so nothing like as strong as the recent 10 year Euro height anomaly.
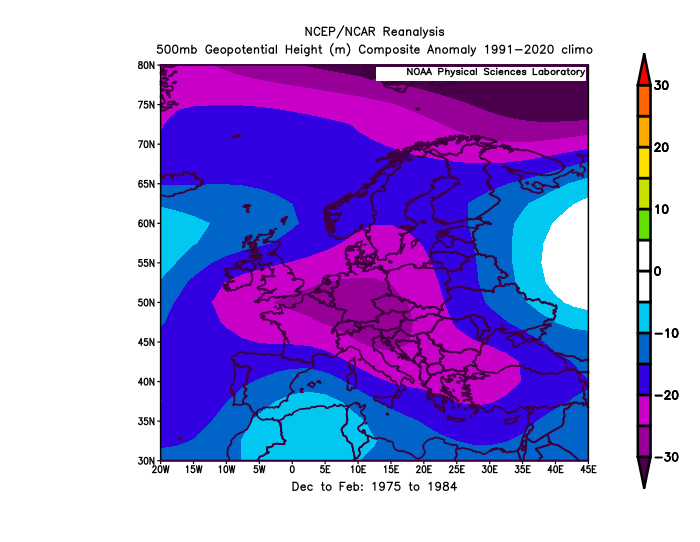
Further back again, 1975-1984. -30m (-3dam).
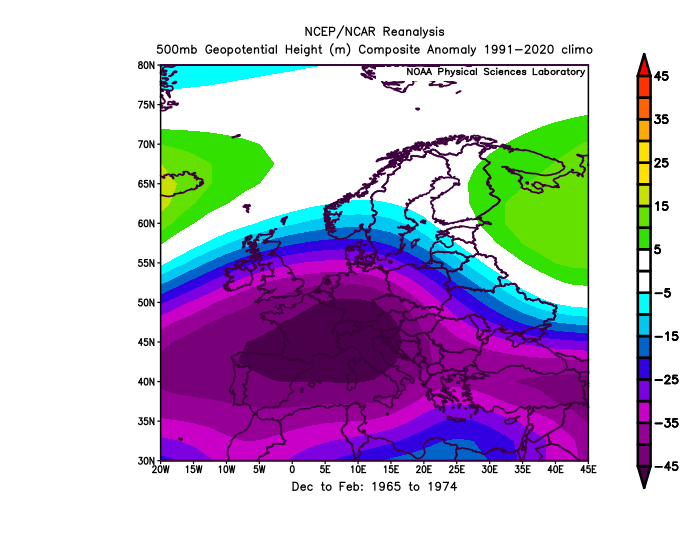
Similar for 1965-1974, but even stronger negative anomalies, around -50m (-5dam).
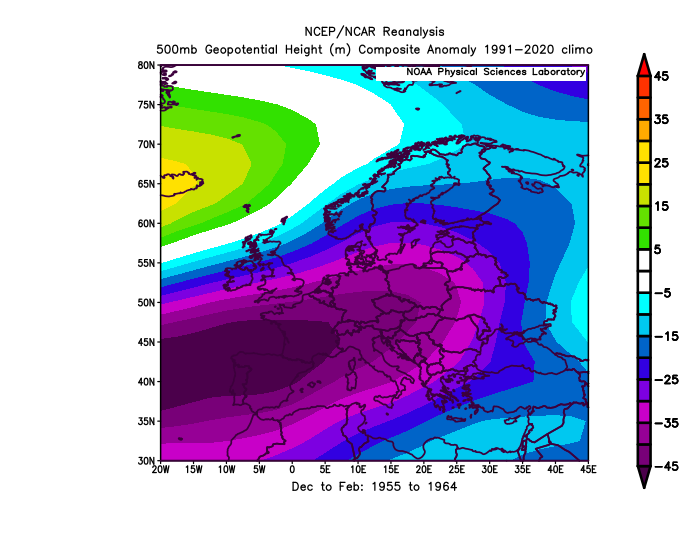
Going back again to 1955-1964, we have a -45m (-4.5dam) anomaly.
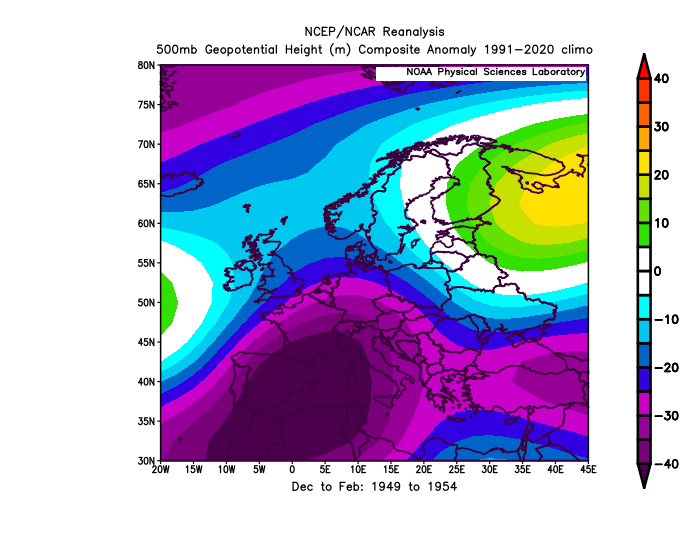
Finally, as far back as we can go, using a 6-year mean from 1949-1954, we have a -40m (-4dam) anomaly.
Summary
I think overall it's pretty much clear what is happening here. You can almost divide the period back to the start of the reanalysis into three distinct eras.
During the first era, from the late 40s through to the mid 80s, the Euro heights anomalies were far below what we expect today, with some interdecadal variability, but all well below even average 1991-2020 climatology, let alone what we've seen in the last 10 years.
The mid-late 80s through to the mid-2010s is another distinct era. Some of the late 80s and early 90s winters had more modern characteristics, though the strength of Euro heights was still not equal to that we see today. There was also a better period from 2005-2014 for cold weather, which coincides with lower Euro heights. Overall, a bit of a mixed bag during this period.
The final era is the one we are in now. You can clearly see that something dramatic has happened. A +2.5dam anomaly is very substantial, and shows a huge change, especially compared to the cold winters of years past from the 60s, 70s and early 80s, when the decadal anomalies were as low as -5dam. The last 10 winters have seen a very substantial tendency towards strong heights to our south, weaker than average pressure to our north, and strong +NAO type patterns being more common.
This very much backs up the case a lot of people have been making that something has changed beyond just global background warming - this is quite a major synoptic change. It also in a slightly more informal and accessible way backs up some of the articles people have been posting on the expanding Azores High.
Anyway, I hope that me taking the time to take a look at this has been useful."