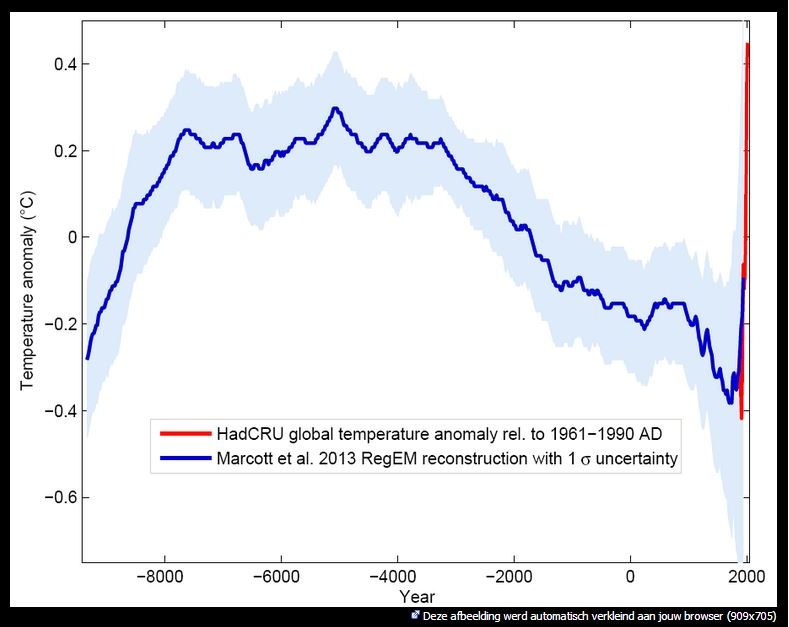
Ik begrijp die grafieken van jou niet, Paul. Die lijken mij niet in overeenstemming met de gangbare data. Waar is de opwarming van de laatste 100 jaar op de noordelijke hemisfeer naartoe? Wat voor anomalieën zijn dat? Wat is de referentieperiode? Zowel evenaar als noordelijke hemisfeer zitten gemiddeld ruim boven nul. De negatieve anomalieën op de zuidelijke hemisfeer zitten licht onder 0 (-0.5). Als je ze samen neemt, zit de hele aarde continue boven de referentieperiode, die dus erg koud moet zijn geweest...
Dit splitsen in drie gebieden, waarbij de evenaar eigenlijk meer oppervlak beslaat dan de andere twee, is ook misleidend, want je kan niet zomaar optellen en delen door drie...
Zijn dit data in overeenstemming met de IPCC rapporten?. Die vertegenwoordigen vandaag toch een zeer brede consensus binnen de klimaatwetenschap en zeggen, dacht ik, wel wat anders dan wat ik uit de door jouw geposte grafieken kan afleiden.
mvg,
Dieter
Deze materie is al eerder ter sprake gebracht op het weerforum (zie link).
Meer informatie over deze bron is te vinden op:
http://www.realclimate.org/index.php/archives/2004/12/about/
RealClimate is a commentary site on climate science by working climate scientists for the interested public and journalists. We aim to provide a quick response to developing stories and provide the context sometimes missing in mainstream commentary. The discussion here is restricted to scientific topics and will not get involved in any political or economic implications of the science. All posts are signed by the author(s), except ‘group’ posts which are collective efforts from the whole team. This is a moderated forum.
Hier een lijst van IPCC rapporten waarmee deze groep zich inhoudelijk conformeert:
What Factors Determine Earth’s Climate?
What is the Relationship between Climate Change and Weather?
What is the Greenhouse Effect?
How do Human Activities Contribute to Climate Change and How do They Compare with Natural Influences?
How are Temperatures on Earth Changing?
How is Precipitation Changing?
Has there been a Change in Extreme Events like Heat Waves, Droughts, Floods and Hurricanes?
Is the Amount of Snow and Ice on the Earth Decreasing?
Is Sea Level Rising?
What Caused the Ice Ages and Other Important Climate Changes Before the Industrial Era?
Is the Current Climate Change Unusual Compared to Earlier Changes in Earth’s History?
Are the Increases in Atmospheric Carbon Dioxide and Other Greenhouse Gases During the Industrial Era Caused by Human Activities?
How Reliable Are the Models Used to Make Projections of Future Climate Change?
Can Individual Extreme Events be Explained by Greenhouse Warming?
Can the Warming of the 20th Century be Explained by Natural Variability?
Are Extreme Events, Like Heat Waves, Droughts or Floods, Expected to Change as the Earth’s Climate Changes?
How Likely are Major or Abrupt Climate Changes, such as Loss of Ice Sheets or Changes in Global Ocean Circulation?
If Emissions of Greenhouse Gases are Reduced, How Quickly do Their Concentrations in the Atmosphere Decrease?
Do Projected Changes in Climate Vary from Region to Region?
De referentie in de grafiek is de periode 1961-1990 AD (zie figuur hieronder). Die is als deze informatie klopt inderdaad behoorlijk koud geweest.
Het opdelen van de aarde in drie klimaatzones is functioneel, als het gaat om de trend in de temperatuur aan te geven. Ik verdenk de auteurs in deze niet van manipulatie.
Ik kan mij niet aan de indruk onttrekken dat deze informatie wetenschappelijk verantwoord is, evenals de website.
Bericht laatst bijgewerkt: 09-11-2013 22:22