And another one (now with the correct link for the Windows installer)
Bericht van: Bram (Oldebroek/Bilthoven) , 08-08-2020 11:23Here is the next update, after having taken a break from working on the viewer. This one solves the issue that downloading of KNMI data doesn't work anymore after the move from KNMI Data Centre (KDC) to KNMI Data Platform (KDP). It also provides support for reading data from TU Delft's radar IDRA, which is located at the top of the measurement tower in Cabauw (at 213 m AGL). And besides that, there are a number of smaller changes and bug fixes. For this version I also have a Linux installer available.
The main changes in a list:
- Support for downloading KNMI data from the KDP. Since you need a key to use KNMI’s new APIs, you need to provide such a key at Settings/Download. You can now also download individual radar files that are older than one day, up to currently 28 October 2019. I don’t know whether it is KNMI’s plan to change this, since the KDP is still strongly under development. But at least for now you can download these older individual radar files, in the same way as before, via the widgets in the menu.
- Support for reading data from TU Delft's radar IDRA in Cabauw. See below for a few more notes about this. For this radar you can adjust the start azimuth of the data (which determines around what azimuth a scan starts and ends) in the right-click menu. This might be useful when an interesting precipitation feature is situated near the current start azimuth of a scan, where neighbouring radials differ in time by about one minute.
- Some optimisation of the dual PRF dealiasing algorithm: It is now by default applied until convergence, which wasn't the case before. This also increases the execution time of the algorithm however, but optimisation of the script limits that time to at most slightly more than before.
There is another change: Near-zero velocities (below 1.5 m/s) are now always masked in the algorithm within a range of 25 km from the radar. Masking means that these velocities are not corrected, and are also not used in the calculation of a reference velocity on which the corrections performed by the algorithm are based. This mask prevents that non-clutter velocities are incorrectly adjusted towards zero in regions with lots of clutter near the radar. Before, near-zero velocities where only masked when the correlation coefficient (CC) was below 85%, which could only be applied when CC was available.
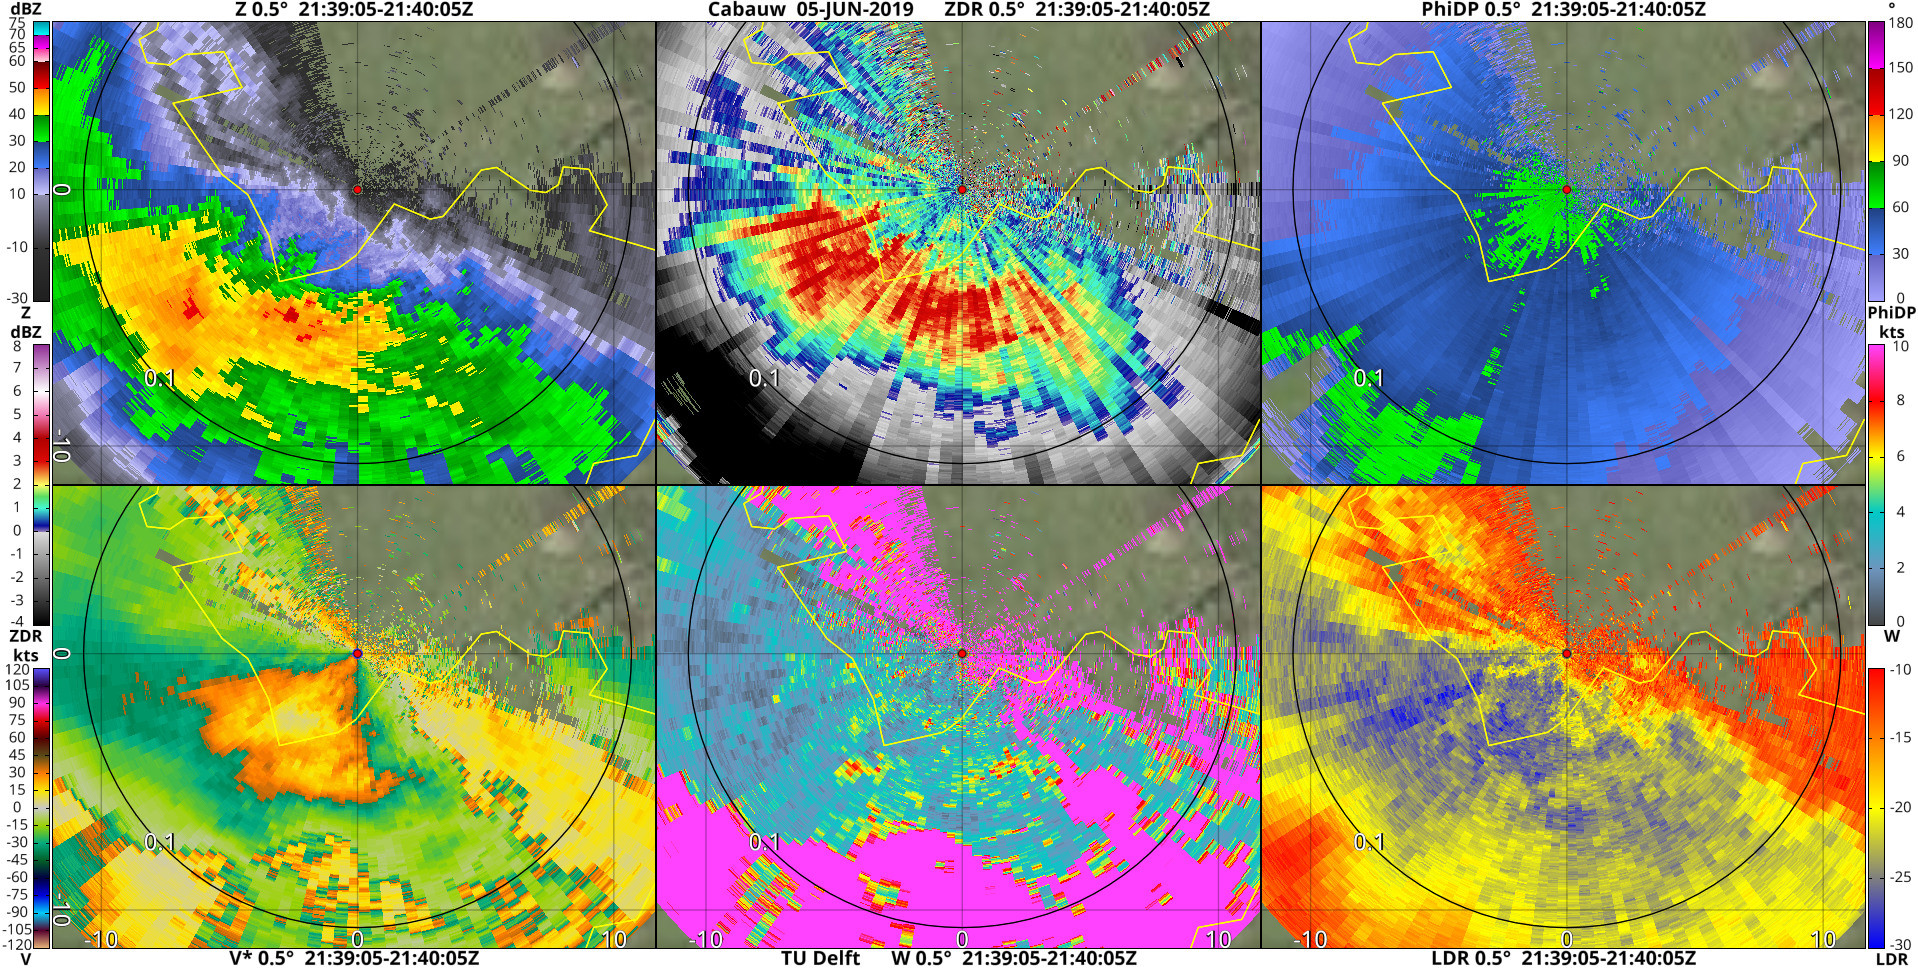
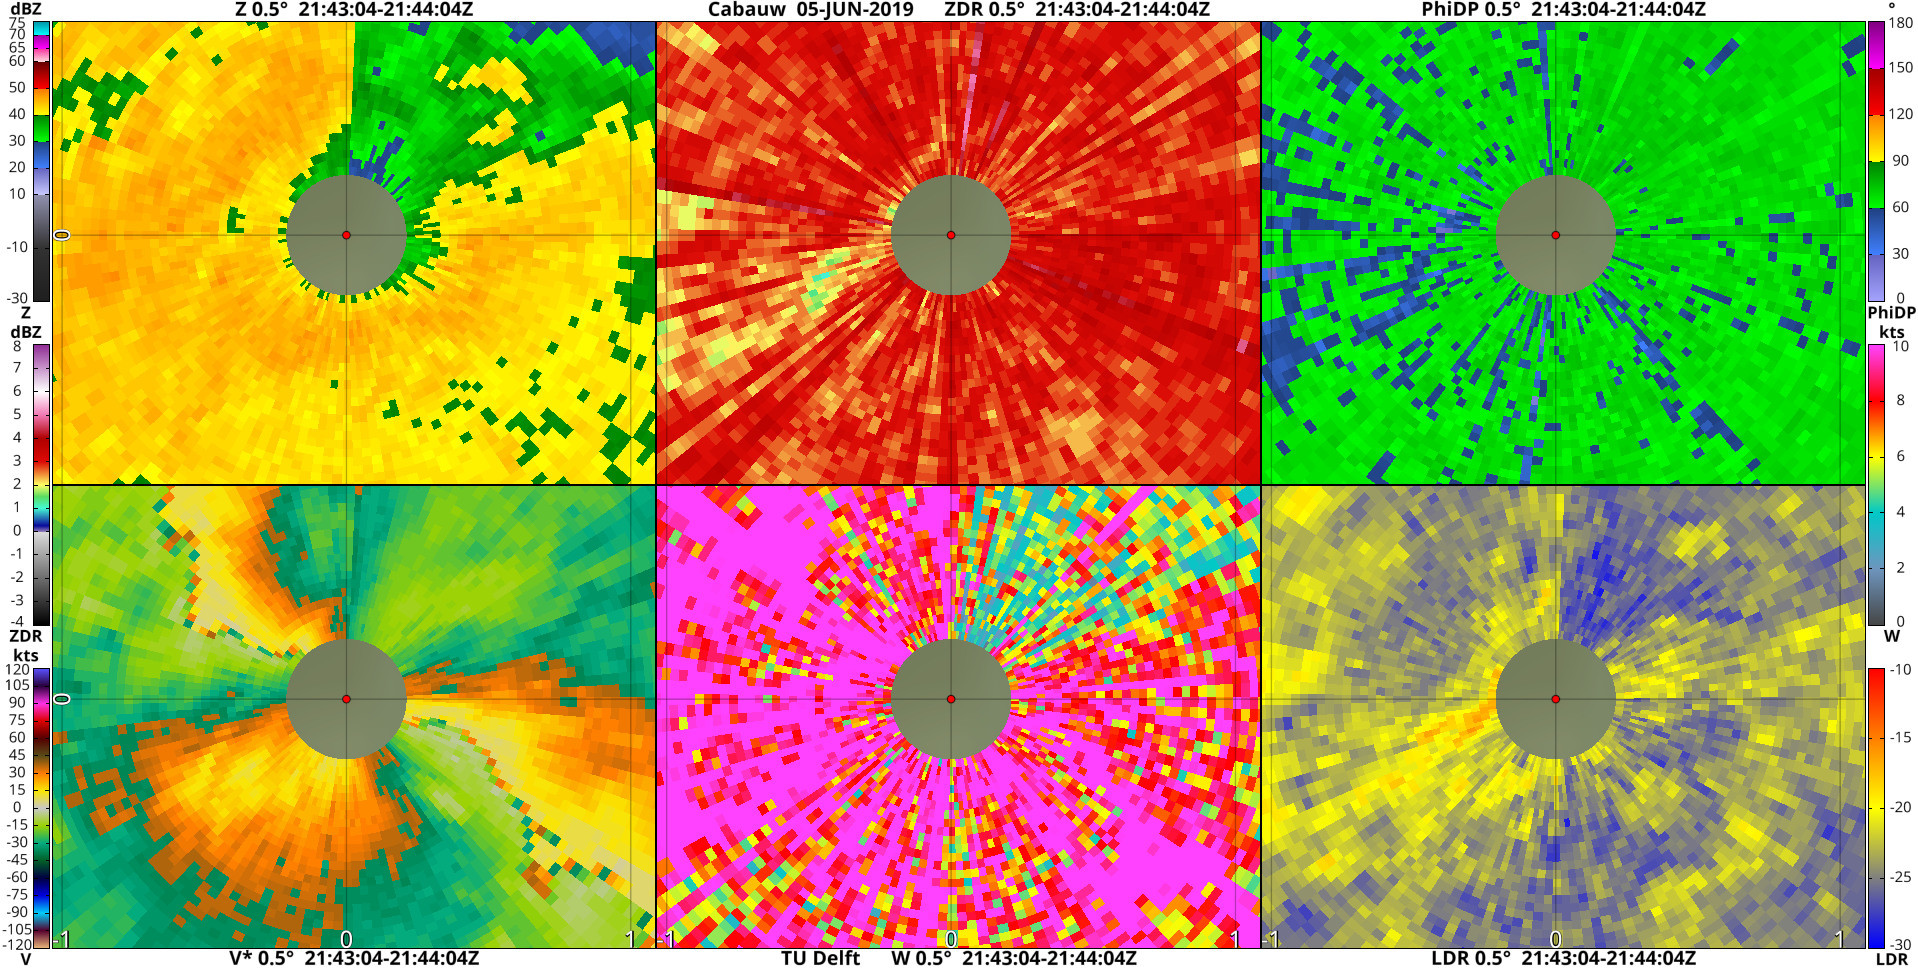
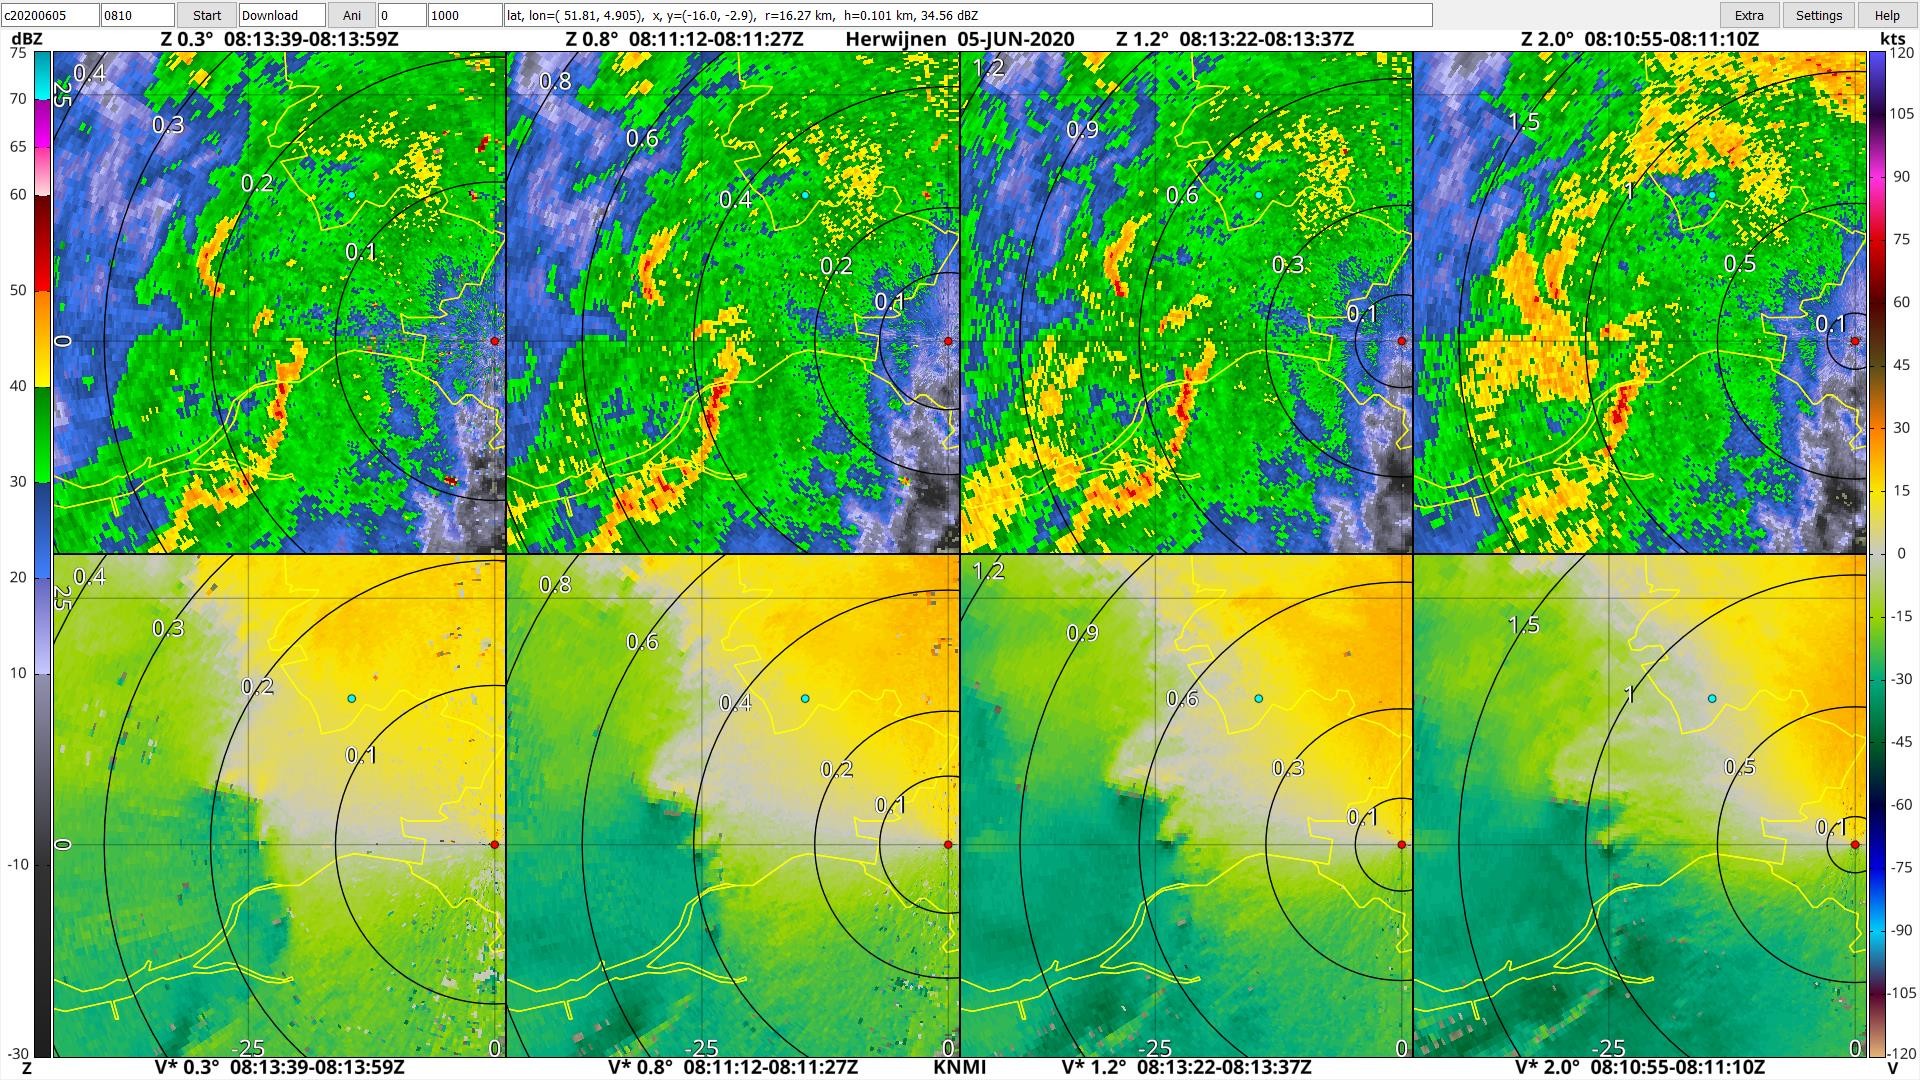
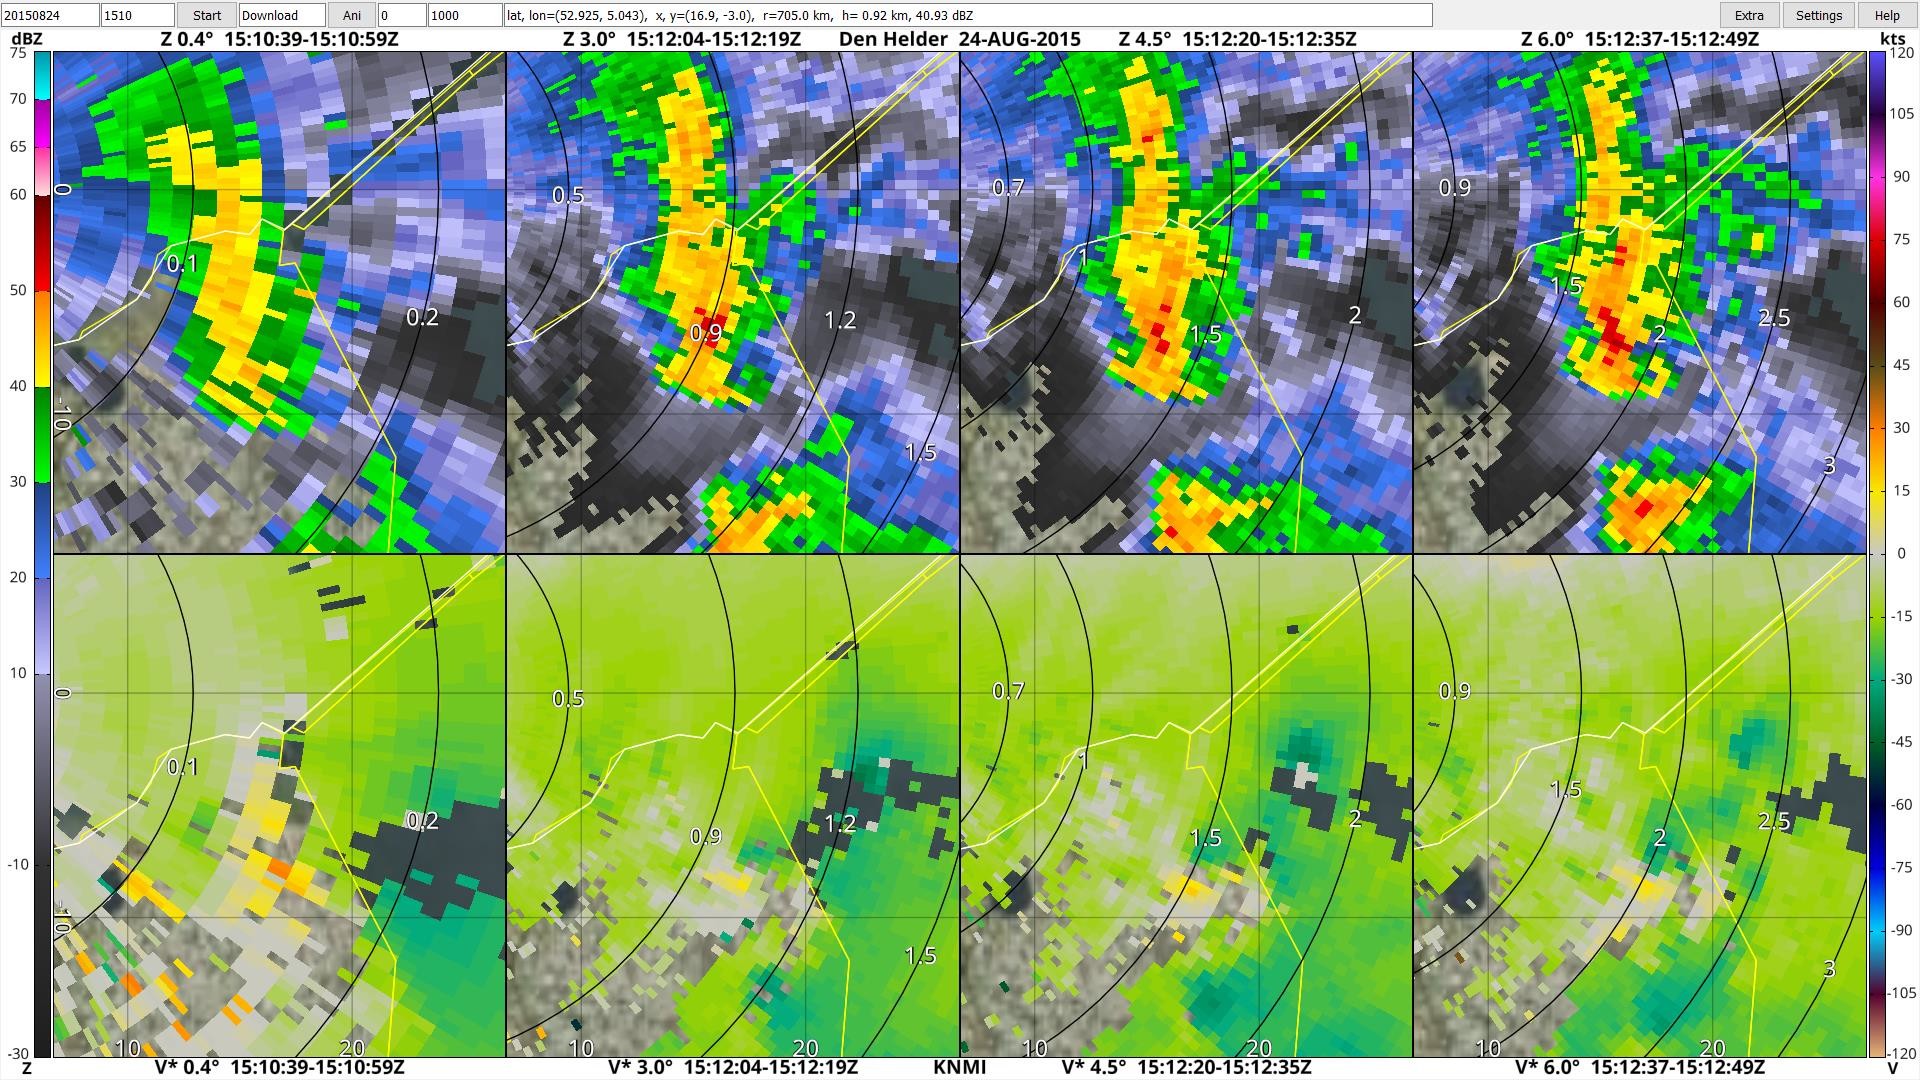
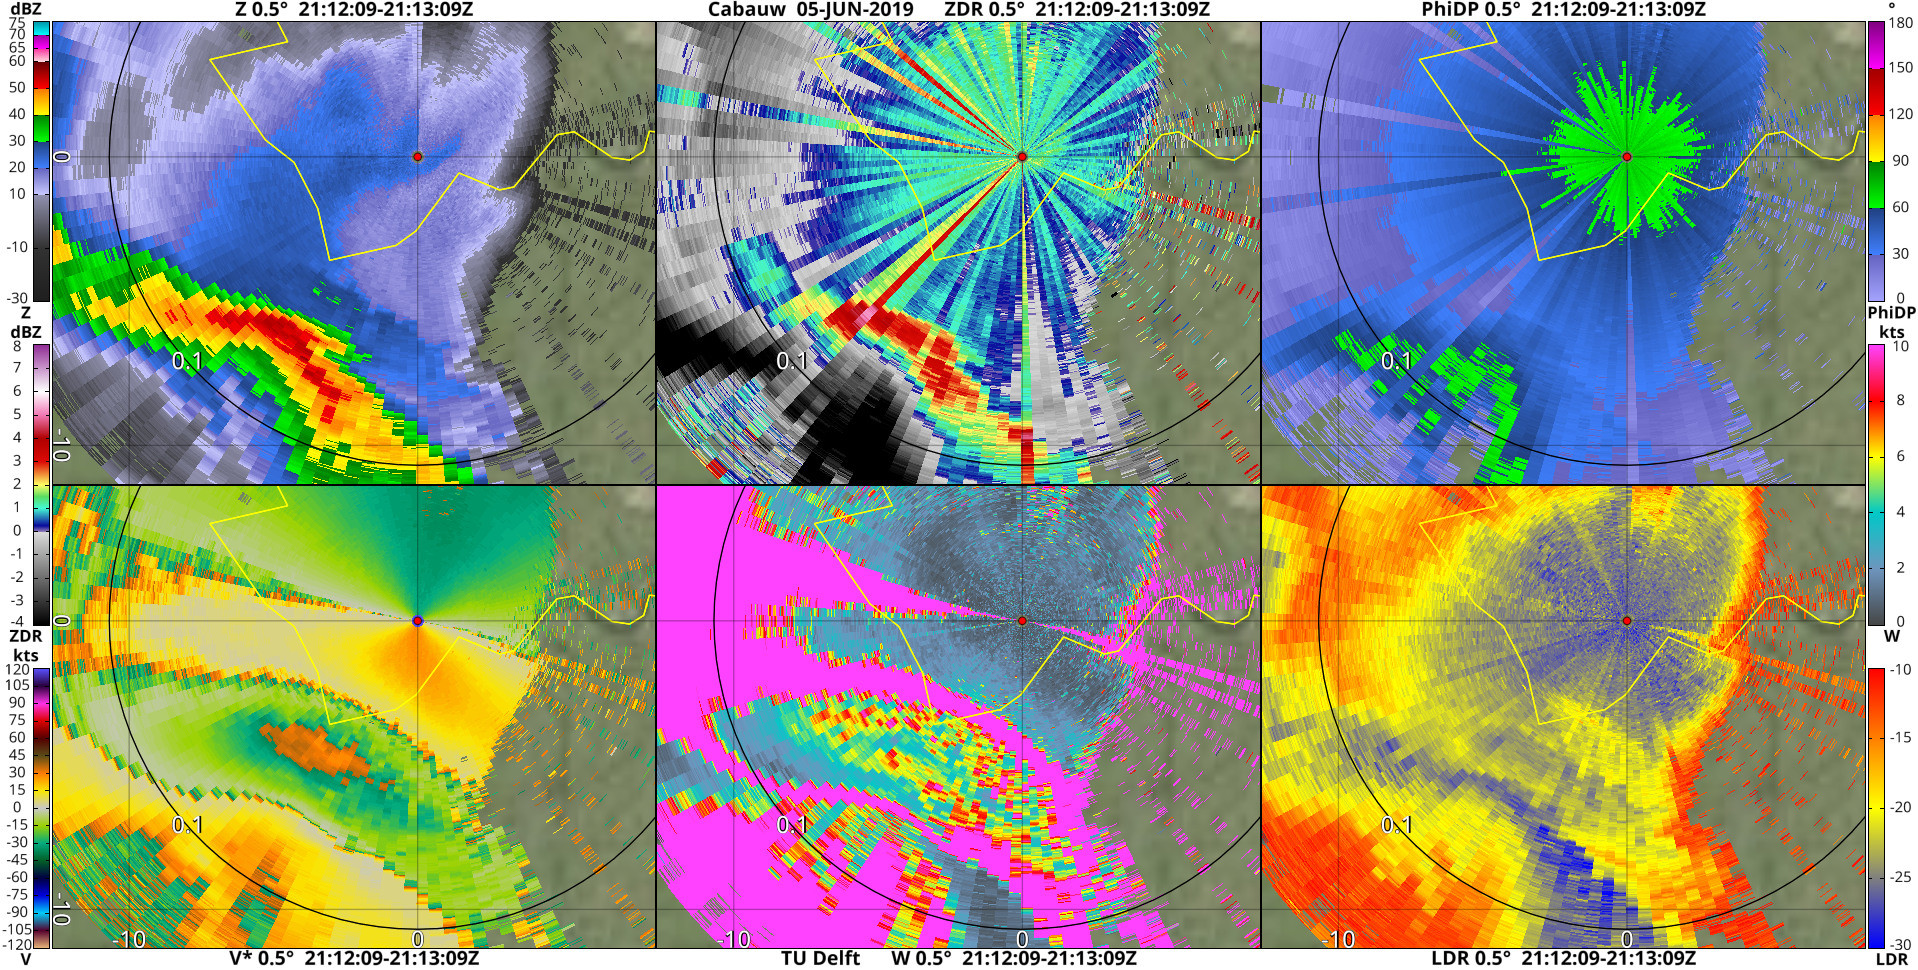
- Support for displaying four new products. These are the Linear Depolarisation Ratio (LDR, X key) available for IDRA/Cabauw, the Signal Quality Index (SQI, Q key), the Clutter Correction (CCOR, T key) and the Clutter Phase Alignment (CPA, Y key). The latter three are only available for the new KNMI radars (Herwijnen and Den Helder), and provide information about data quality.
- Some renamings in the titles, in order to make these a bit shorter: Base Velocity (BV) is now simply named Velocity (V), dealiased velocity is now named V* instead of V (corr), and vertically polarized scans are now indicated by a suffix ‘v’ instead of ‘(V)’.
- Work on improved text positioning and scaling as a function of font size. The default font sizes should now also give better results on screens with resolutions different from mine. See below for a few tips regarding layout settings.
- A number of smaller changes and bug fixes. I also updated some outdated text in the Help.
Regarding the support for reading IDRA data: Since the azimuthal spacing between radials is not guaranteed to be constant, I decided to remap the data onto a grid with 1500 radials, which is more than 10 times as much as for the original data (where a scan usually consists of about 143 radials). This leads to slight position errors up to 0.12 degrees in the azimuthal direction. Another consequence is that data interpolation does not produce desired results.
I also want to note that there have been/are a few issues with the data. There were periods in time during which a number of radial sectors were missing, at least in certain months in 2013 and 2014. And since at least August 2018 there is an issue with the velocity data, and I don’t know whether that is fixed yet. Velocities that are actually zero now appear as +- the Nyquist velocity, and the measured speeds decrease when the actual speeds increase. A simple procedure can correct for this in regions without mixing of positive and negative velocities, but it is far from perfect due to the frequent occurrence of such mixing. For data between 25 August 2018 and 27 August 2019 (the last date I checked) I apply this procedure when dealiasing of velocity is selected (SHIFT+V).
A final note: For other radars the program automatically finds the radar volume that is nearest in time to your selected date and time. That does not work for IDRA, so if no data is available for the selected time, then you need to manually search for times with data available.
Regarding layout settings:
If you use the program regularly, then I recommend to take a look at the settings at Settings/Main and Settings/Map, to optimise these towards your preferences. The default settings might work reasonably, but might as well require some adjustments. Especially the font sizes, line widths and the settings for the background map (background color, map visibility and map color filter) might need some attention.
A general tip when you are new to the program:
First take a look at the tabs General, Menu and Keyboard of the Help, in order to get started.
Here are the installers. Windows: https://drive.google.com/file/d/1odlChobf093U6KZAc2UQoQRooi5US8ai/view?usp=sharing.
IMPORTANT: You still need to give the program admin rights, something I want to get rid before a next update. How to do that in a permanent way: Find the location of the executable (probably in C:/Program Files (x86)/NLradar/Python_files, named nlr.exe) -> right-click at it -> click ‘Compatibility’ -> check ‘Run this program as an administrator’.
Linux: https://drive.google.com/file/d/16vds1UDXXJxACWo_p-P4USkvHldrM0H8/view?usp=sharing.
The Linux installer is in fact not really an installer, but a zip-archive that you need to extract at the for you desired location. You can then start the program by running the executable ‘nlr’ in NLradar/Python_files.
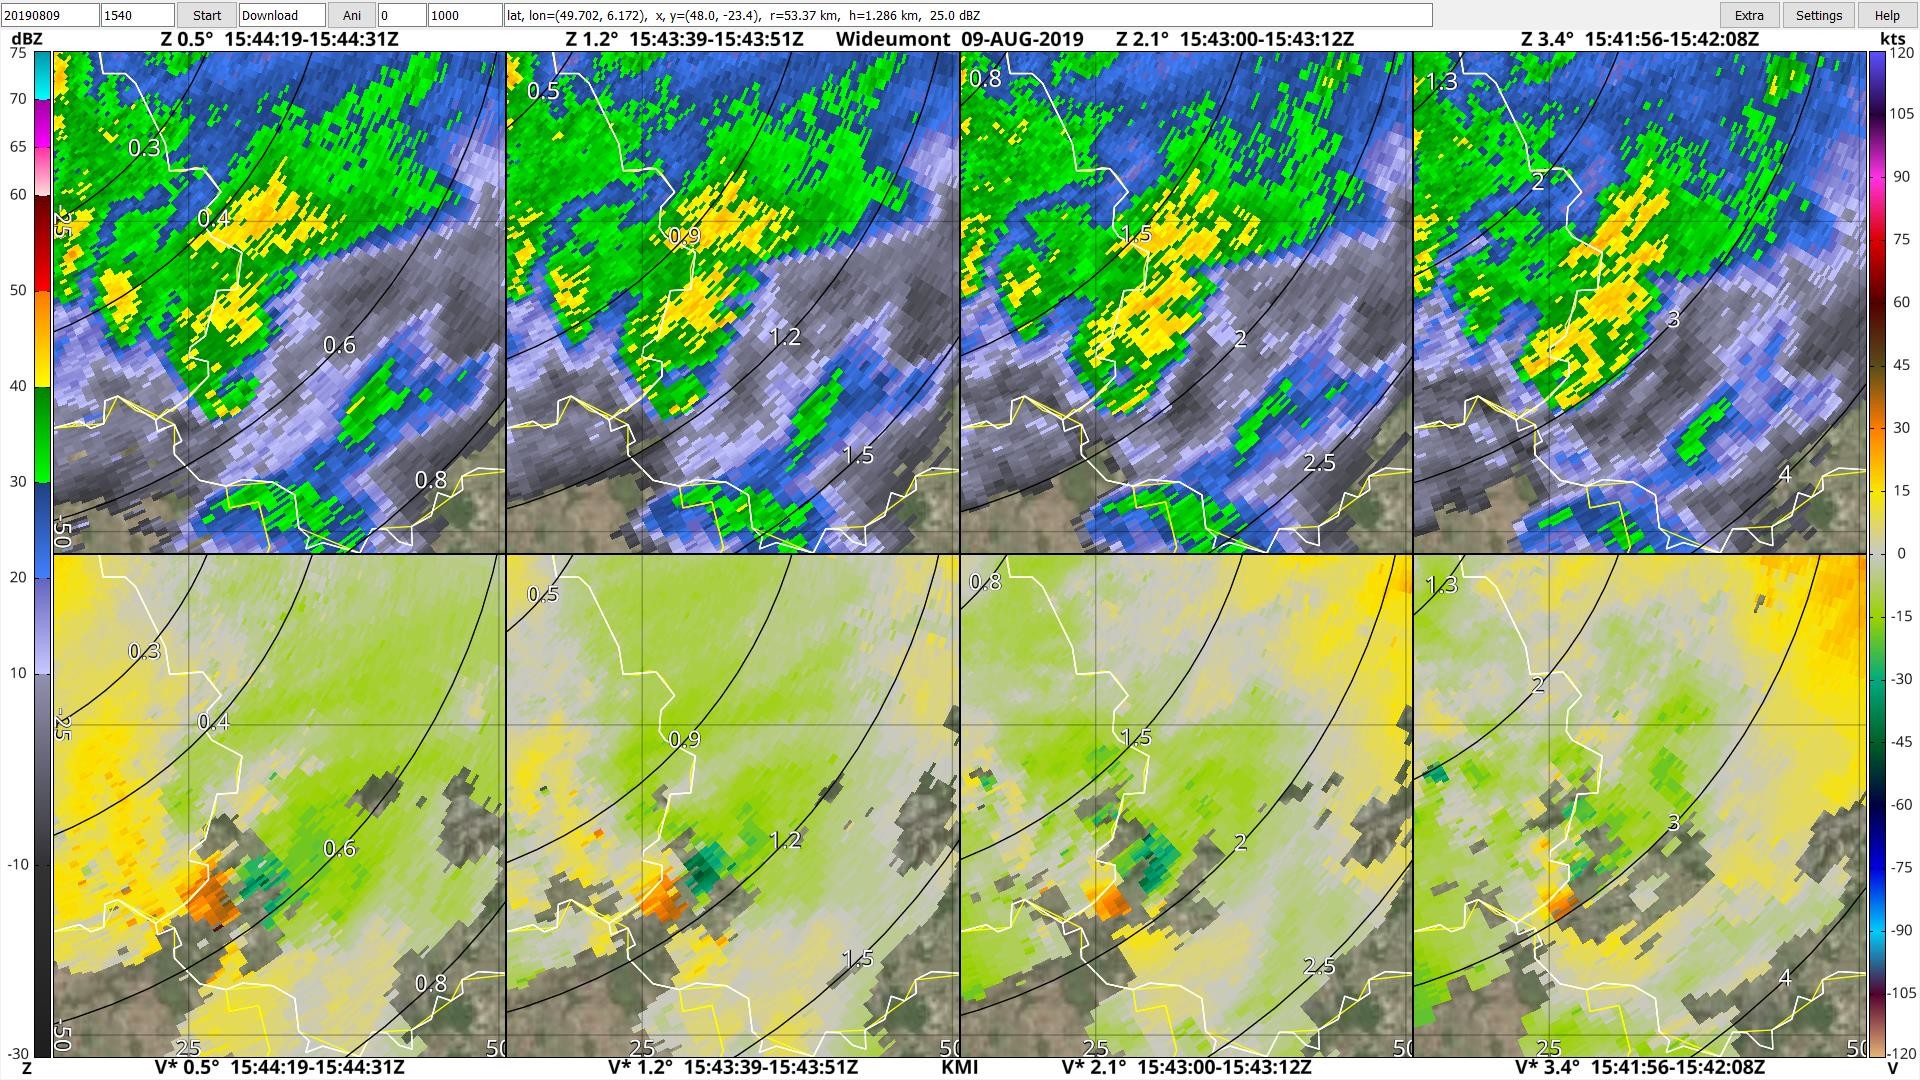
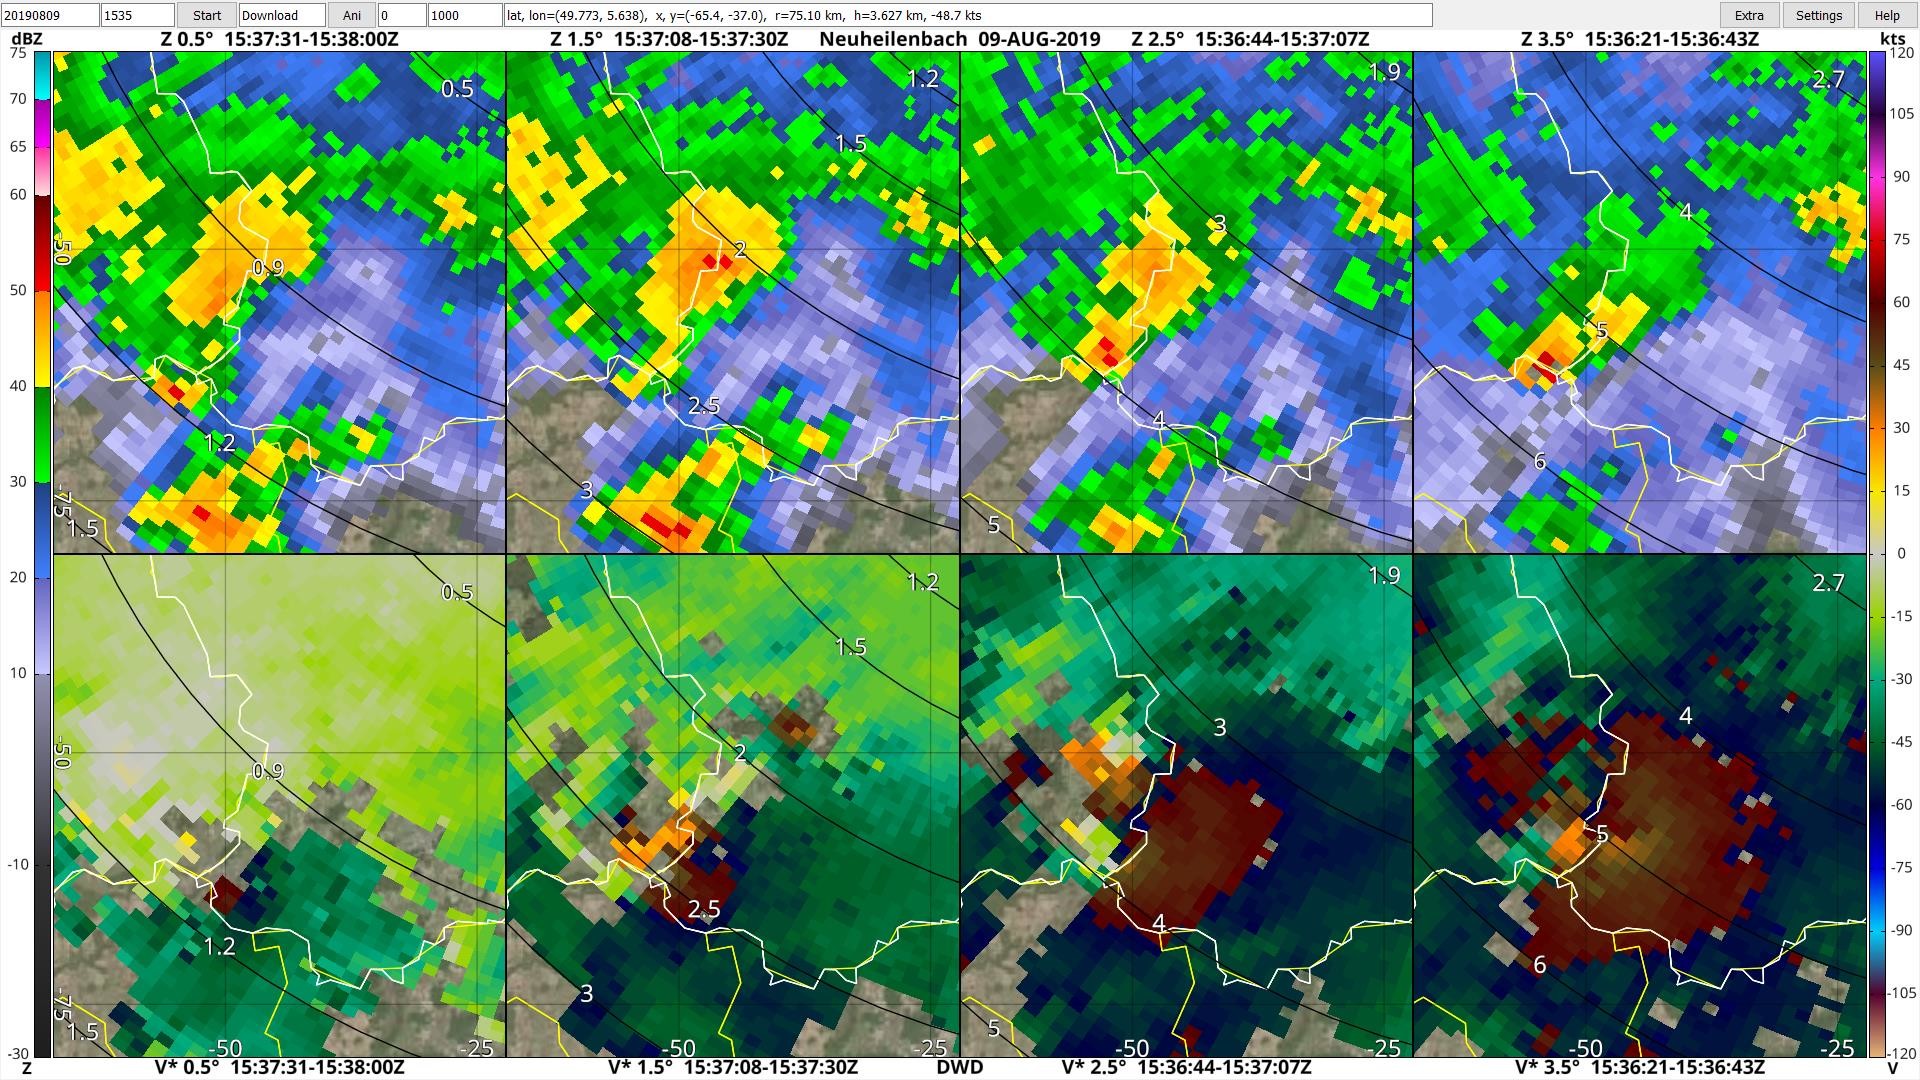
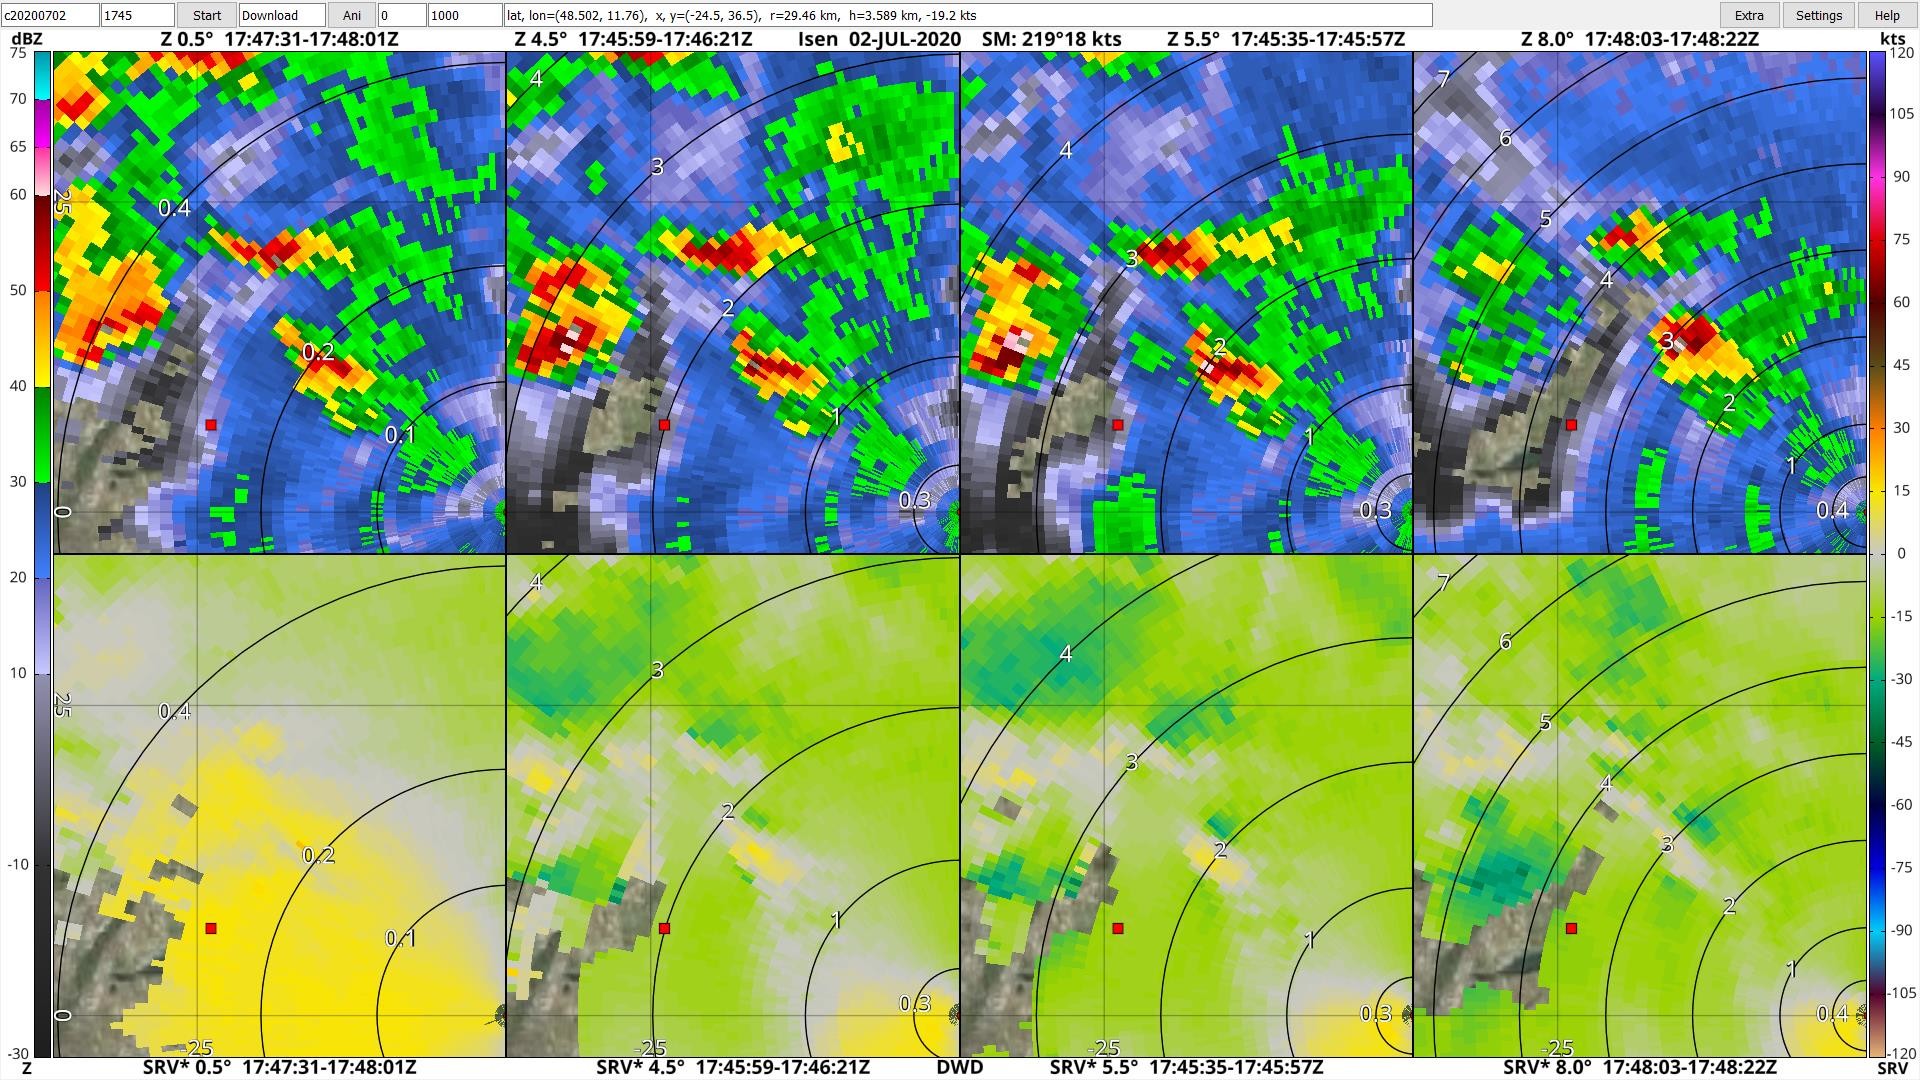
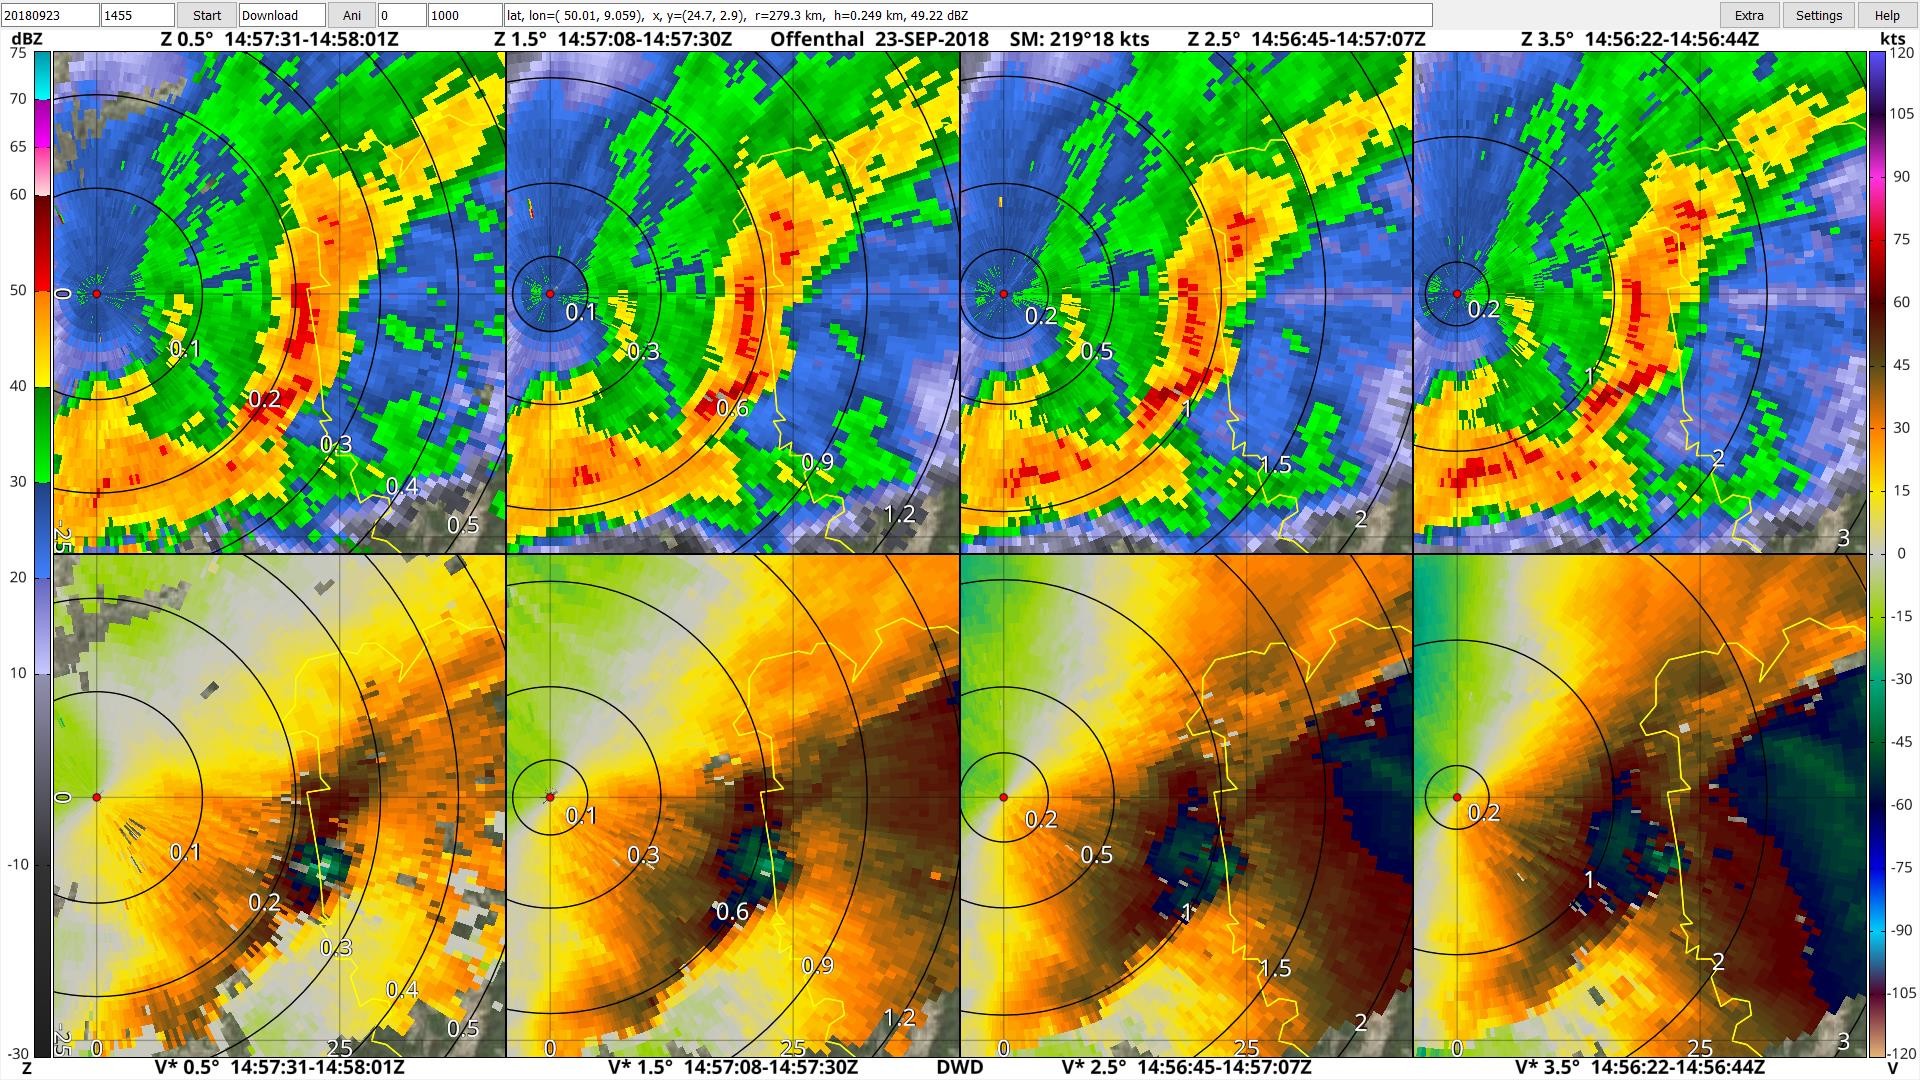
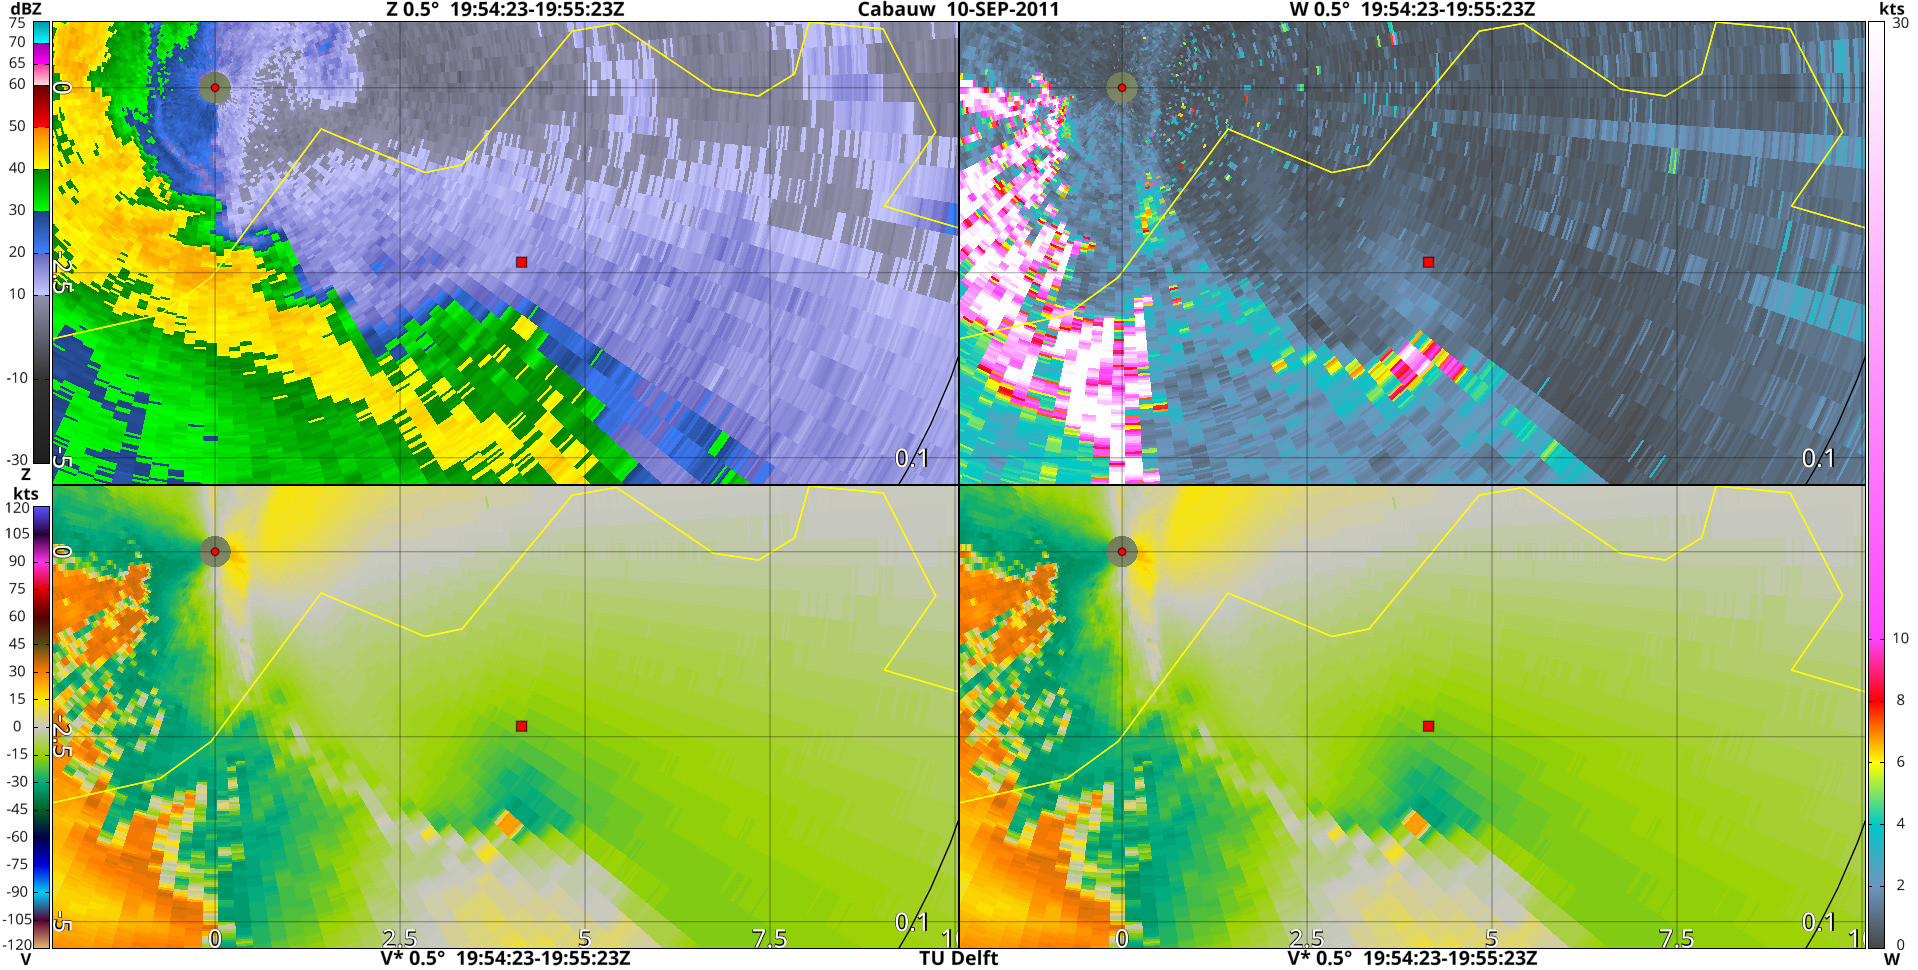
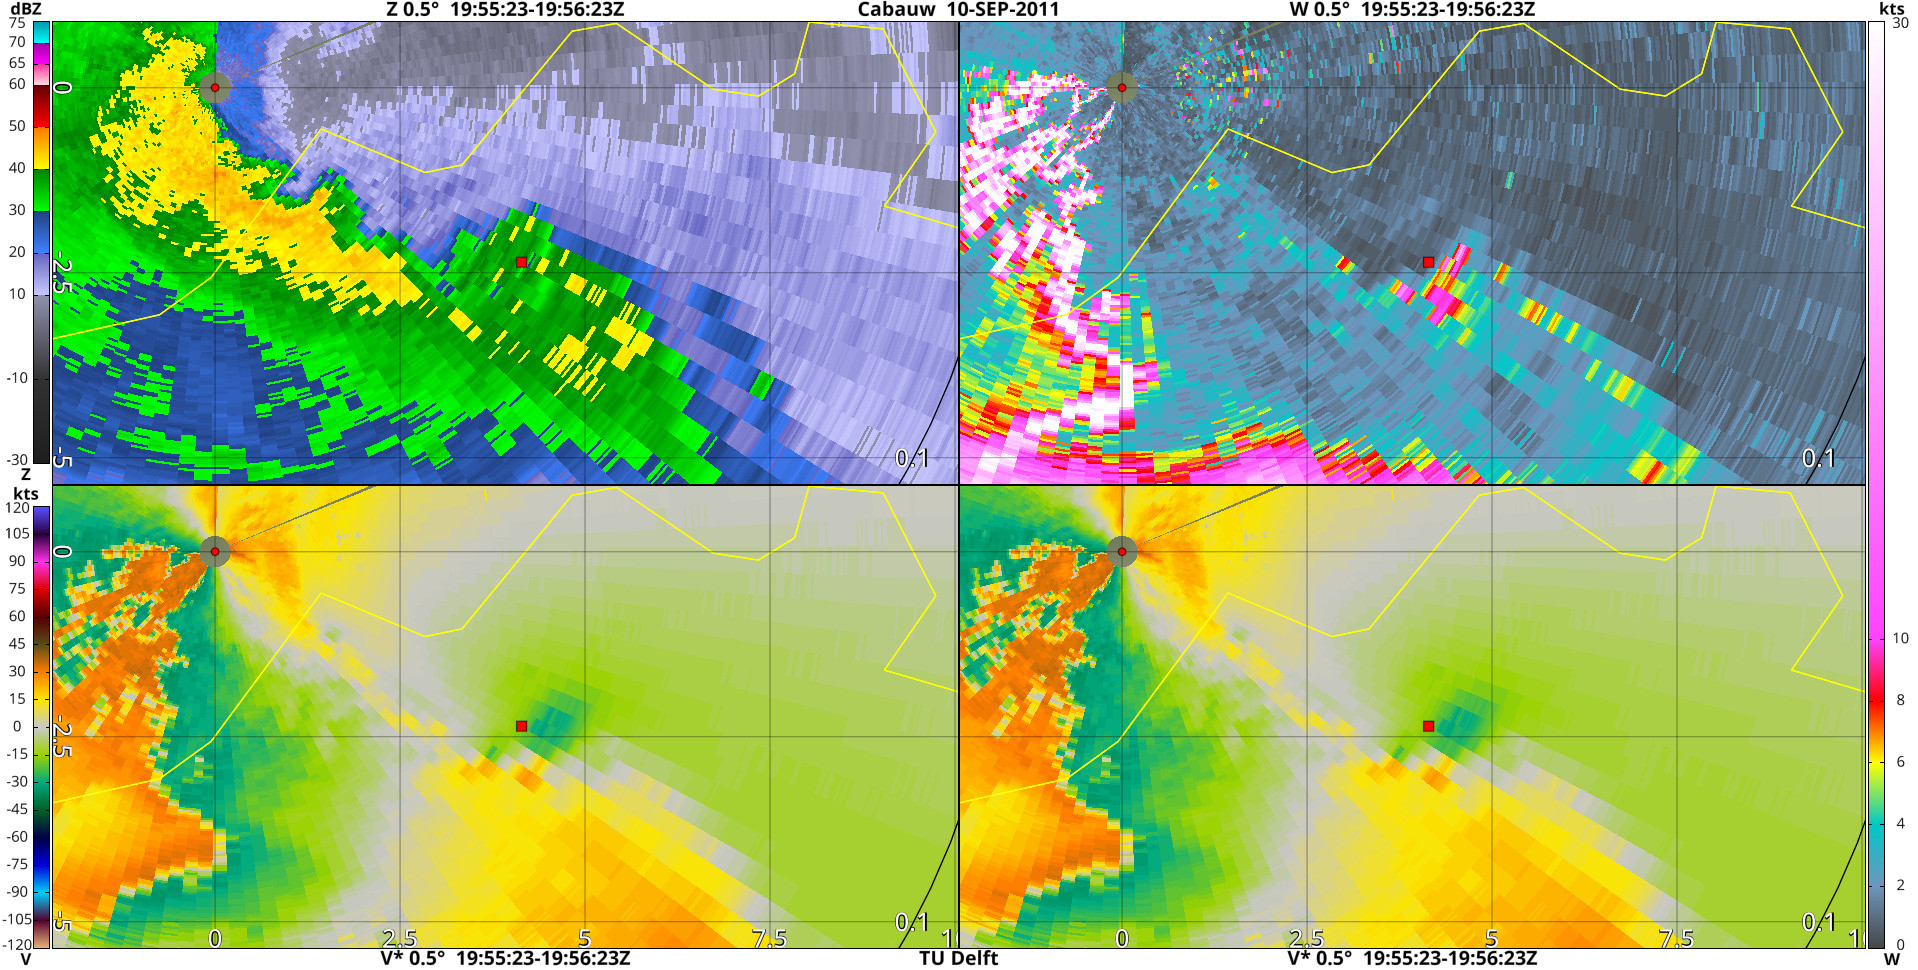
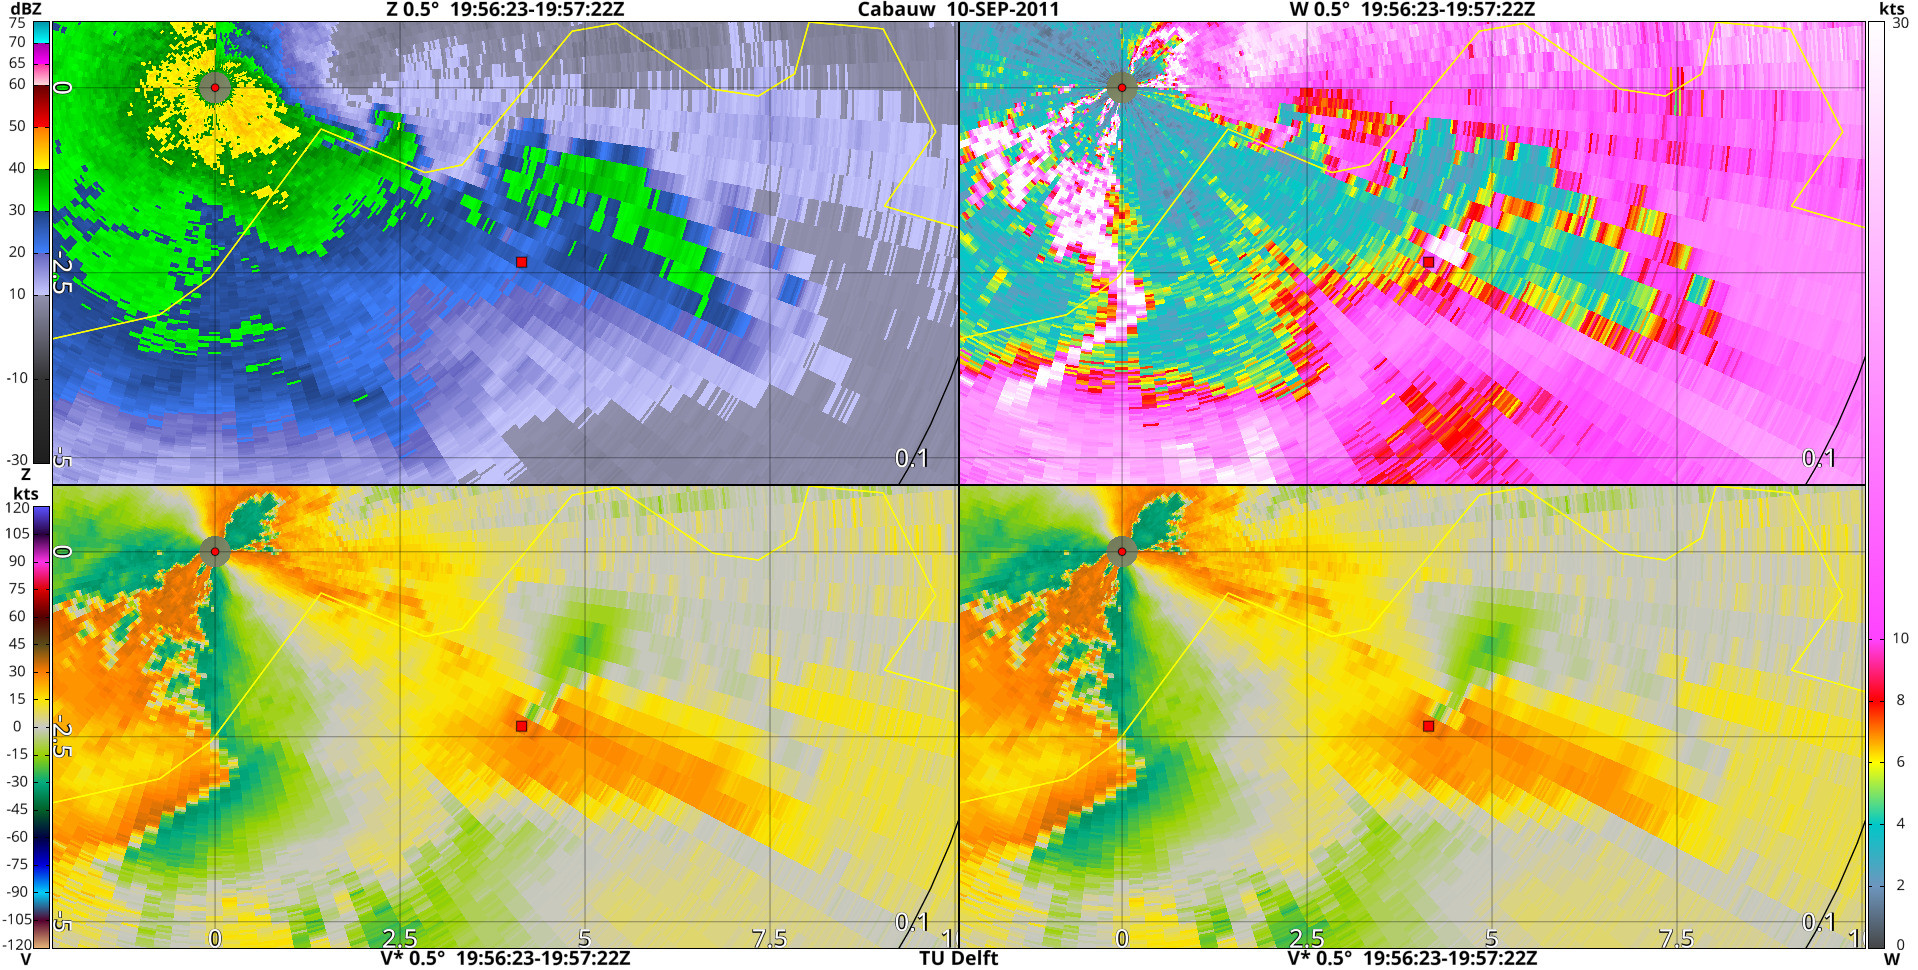
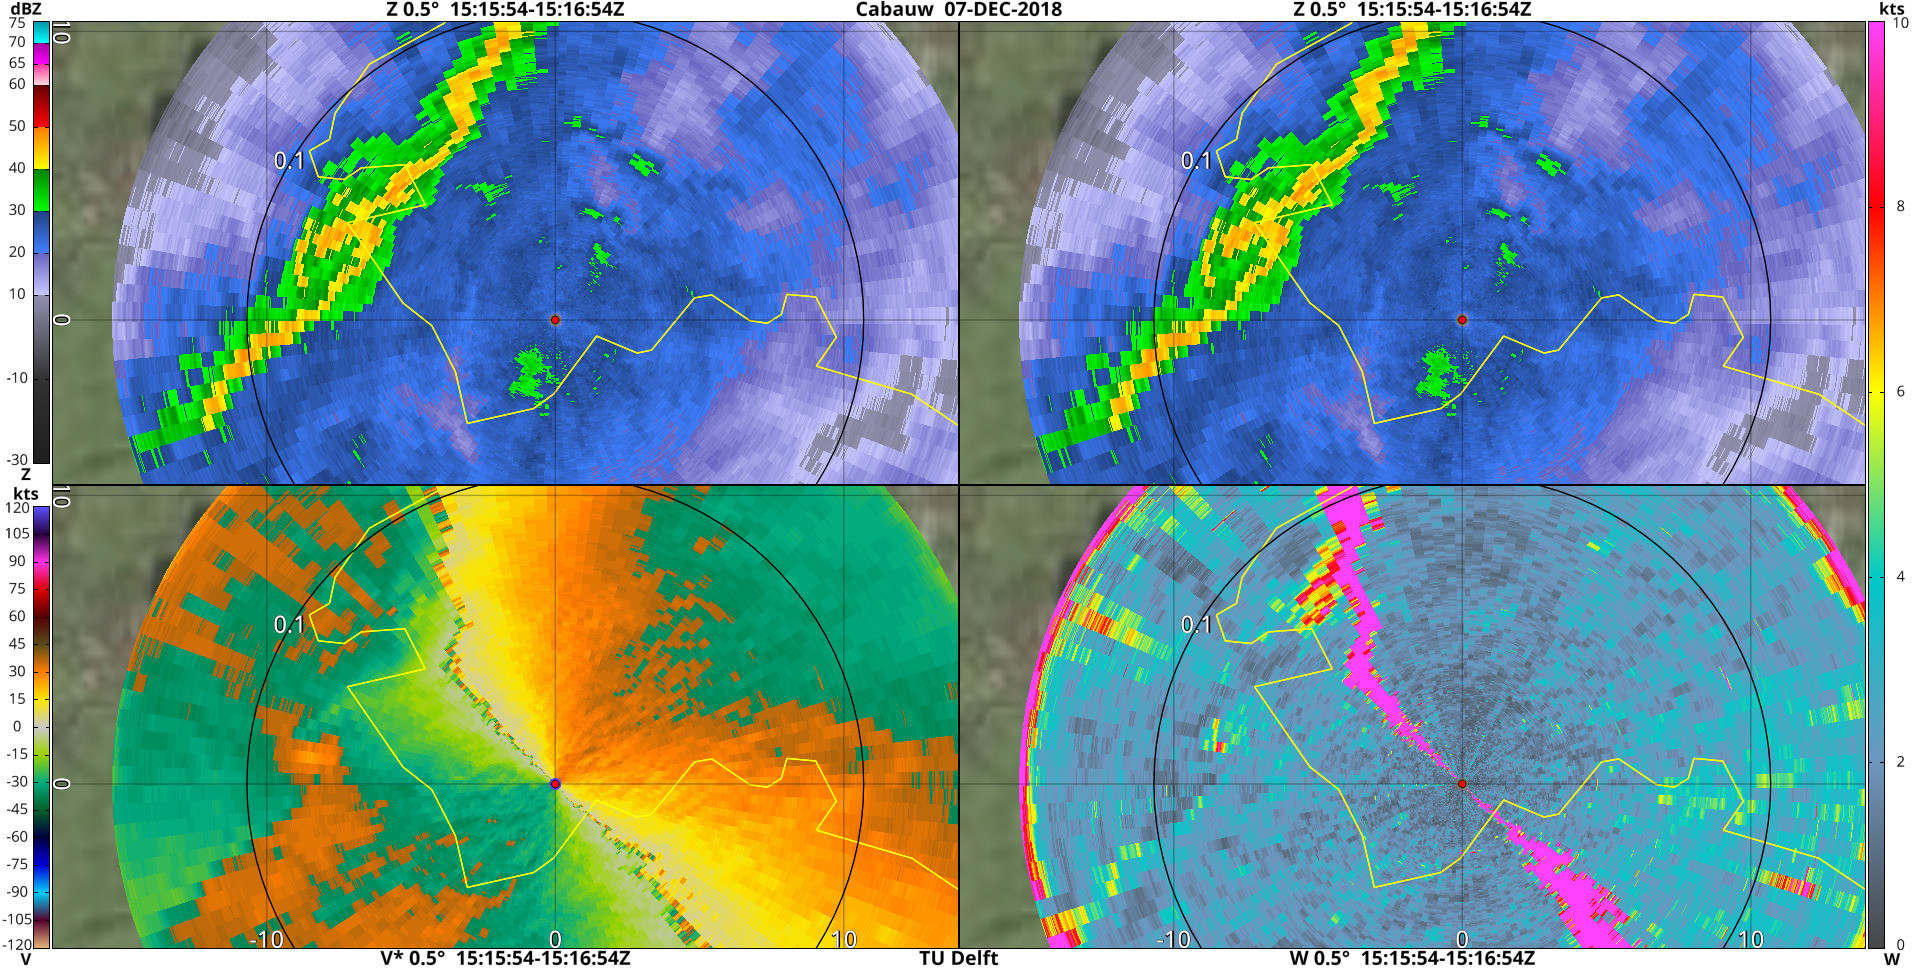
Here are a number of pictures of the program. Further below I also have a number of radar images specifically from IDRA, showing interesting convective cases. Two of these were associated with tornadoes within the radar's range, and I have provided some description for these.
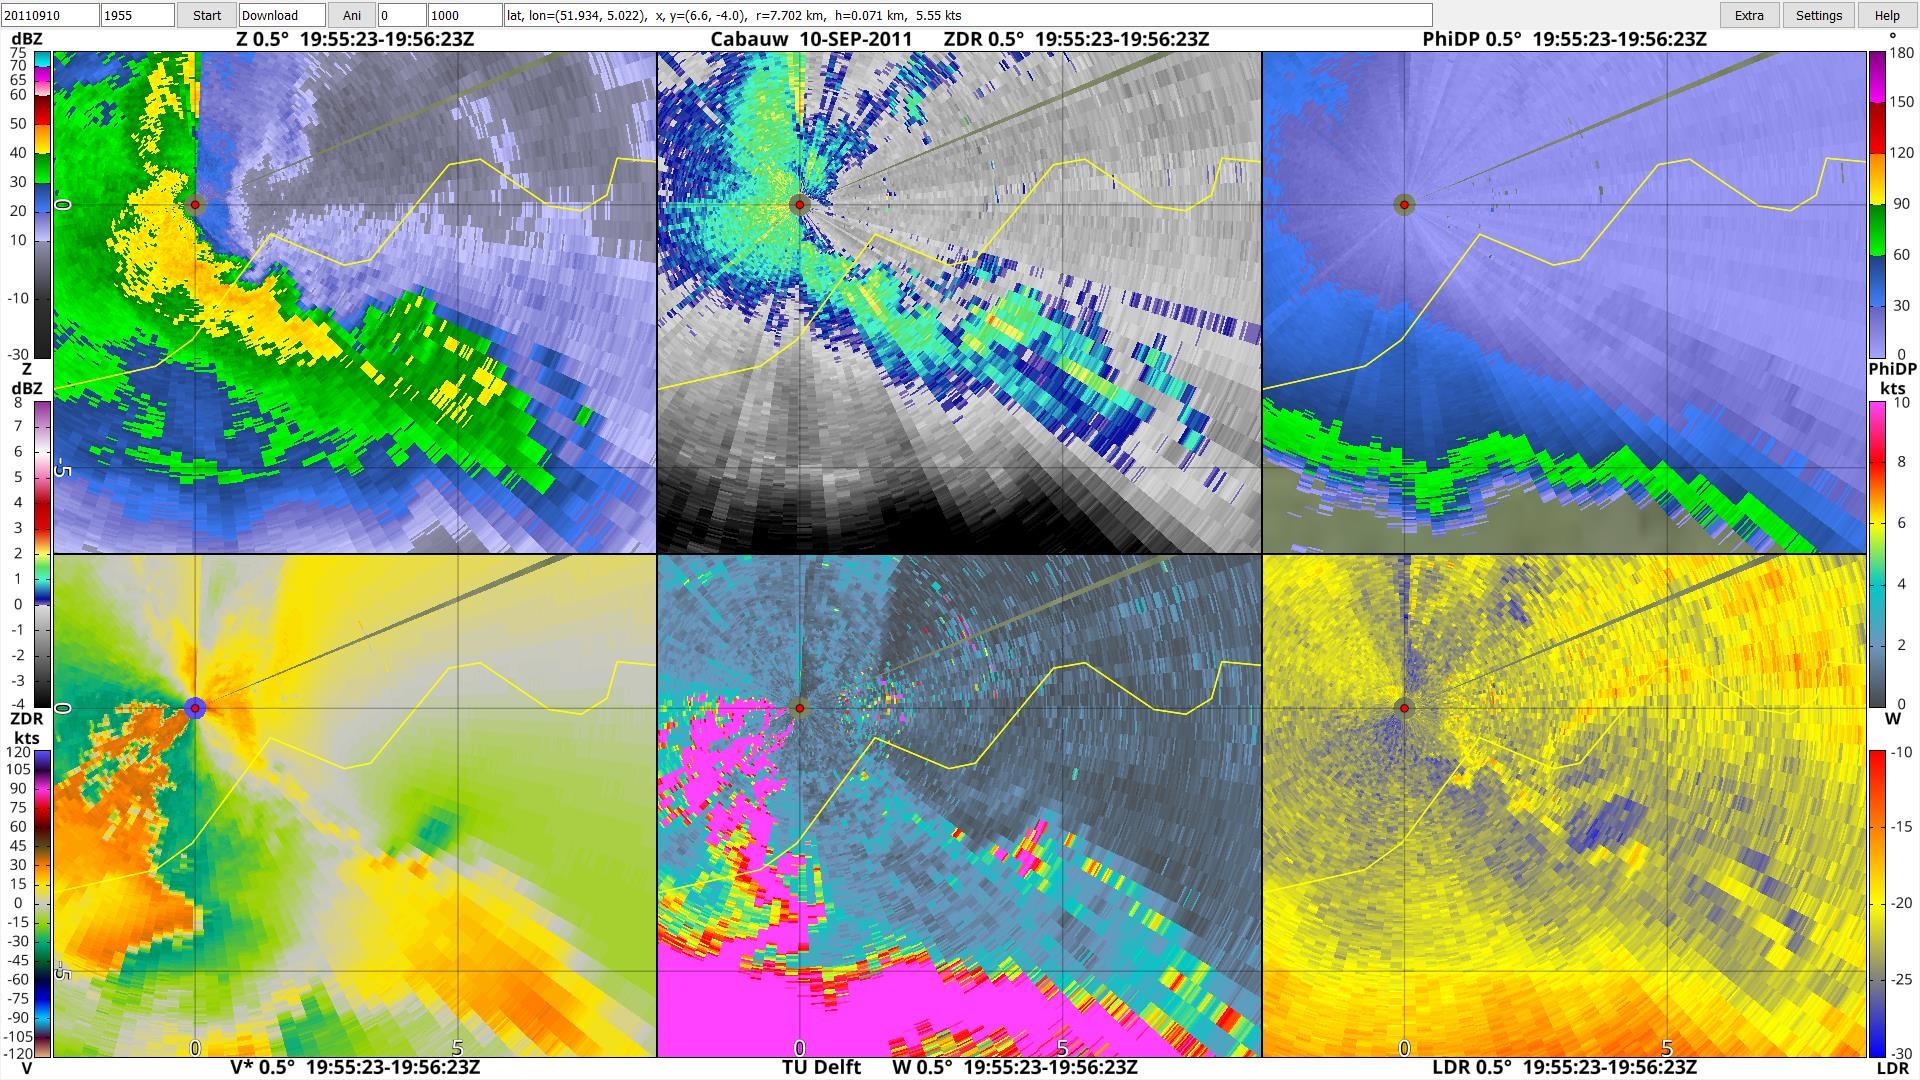
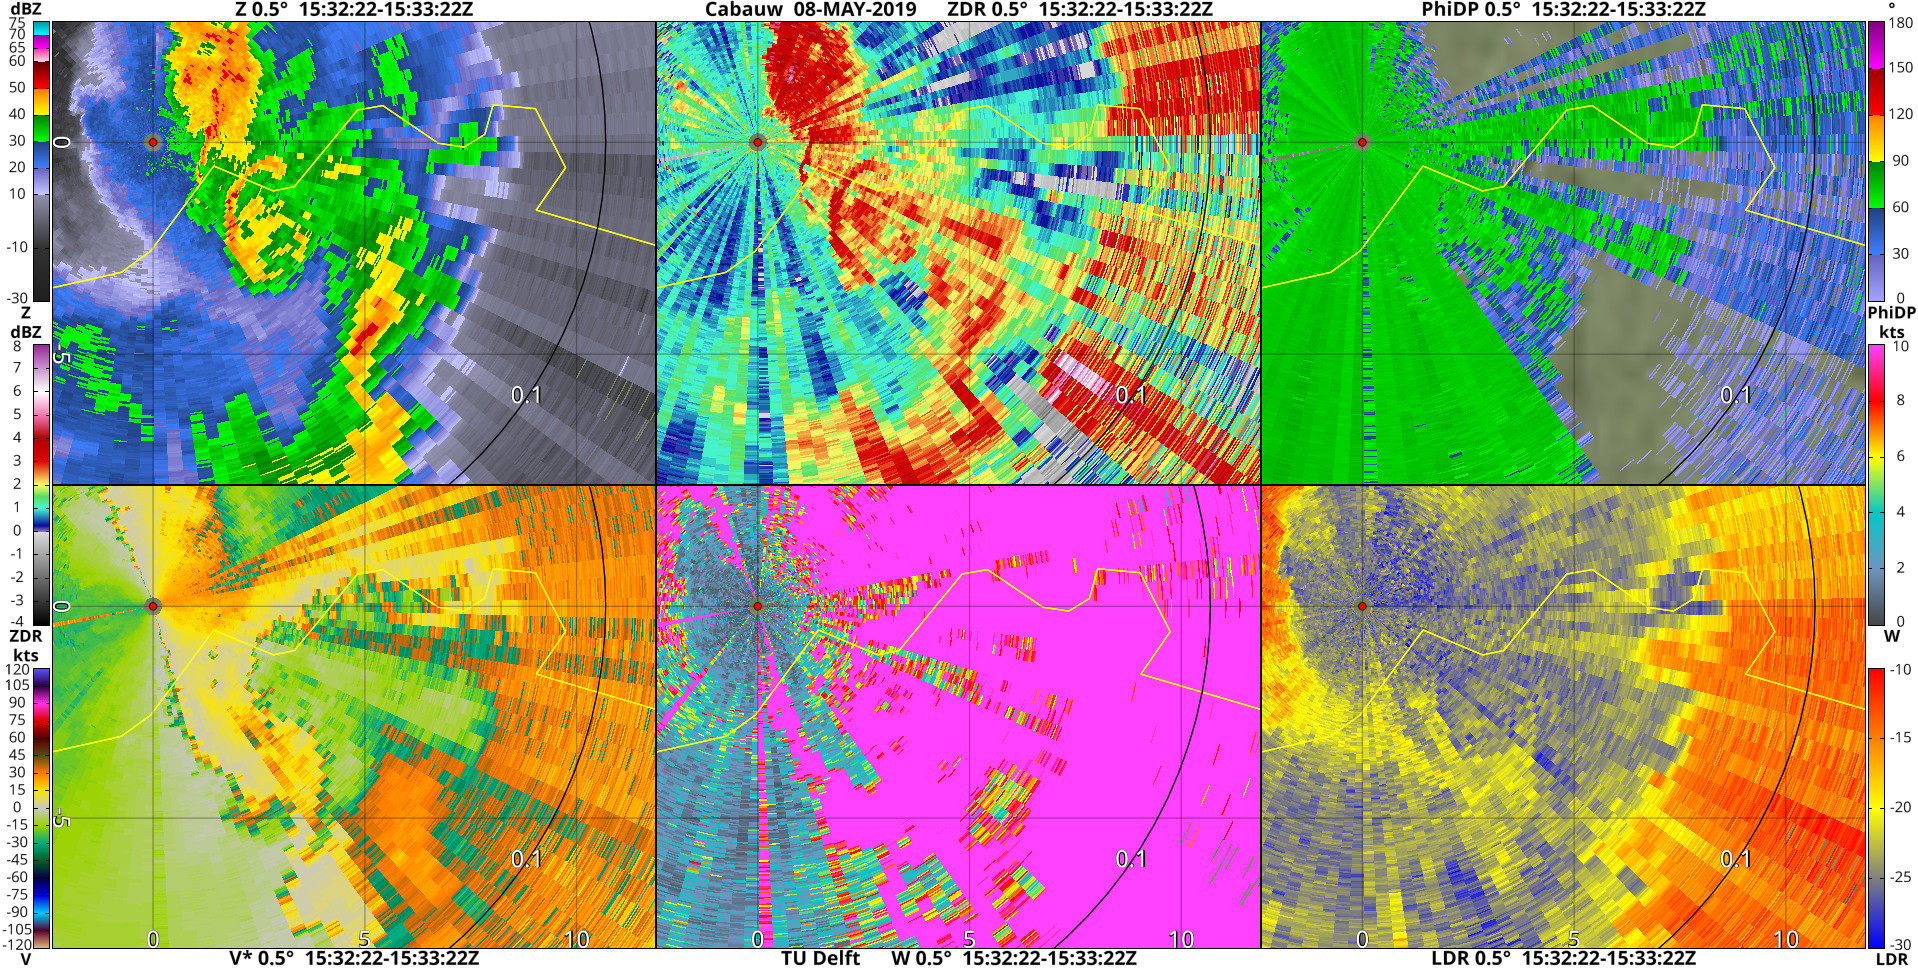
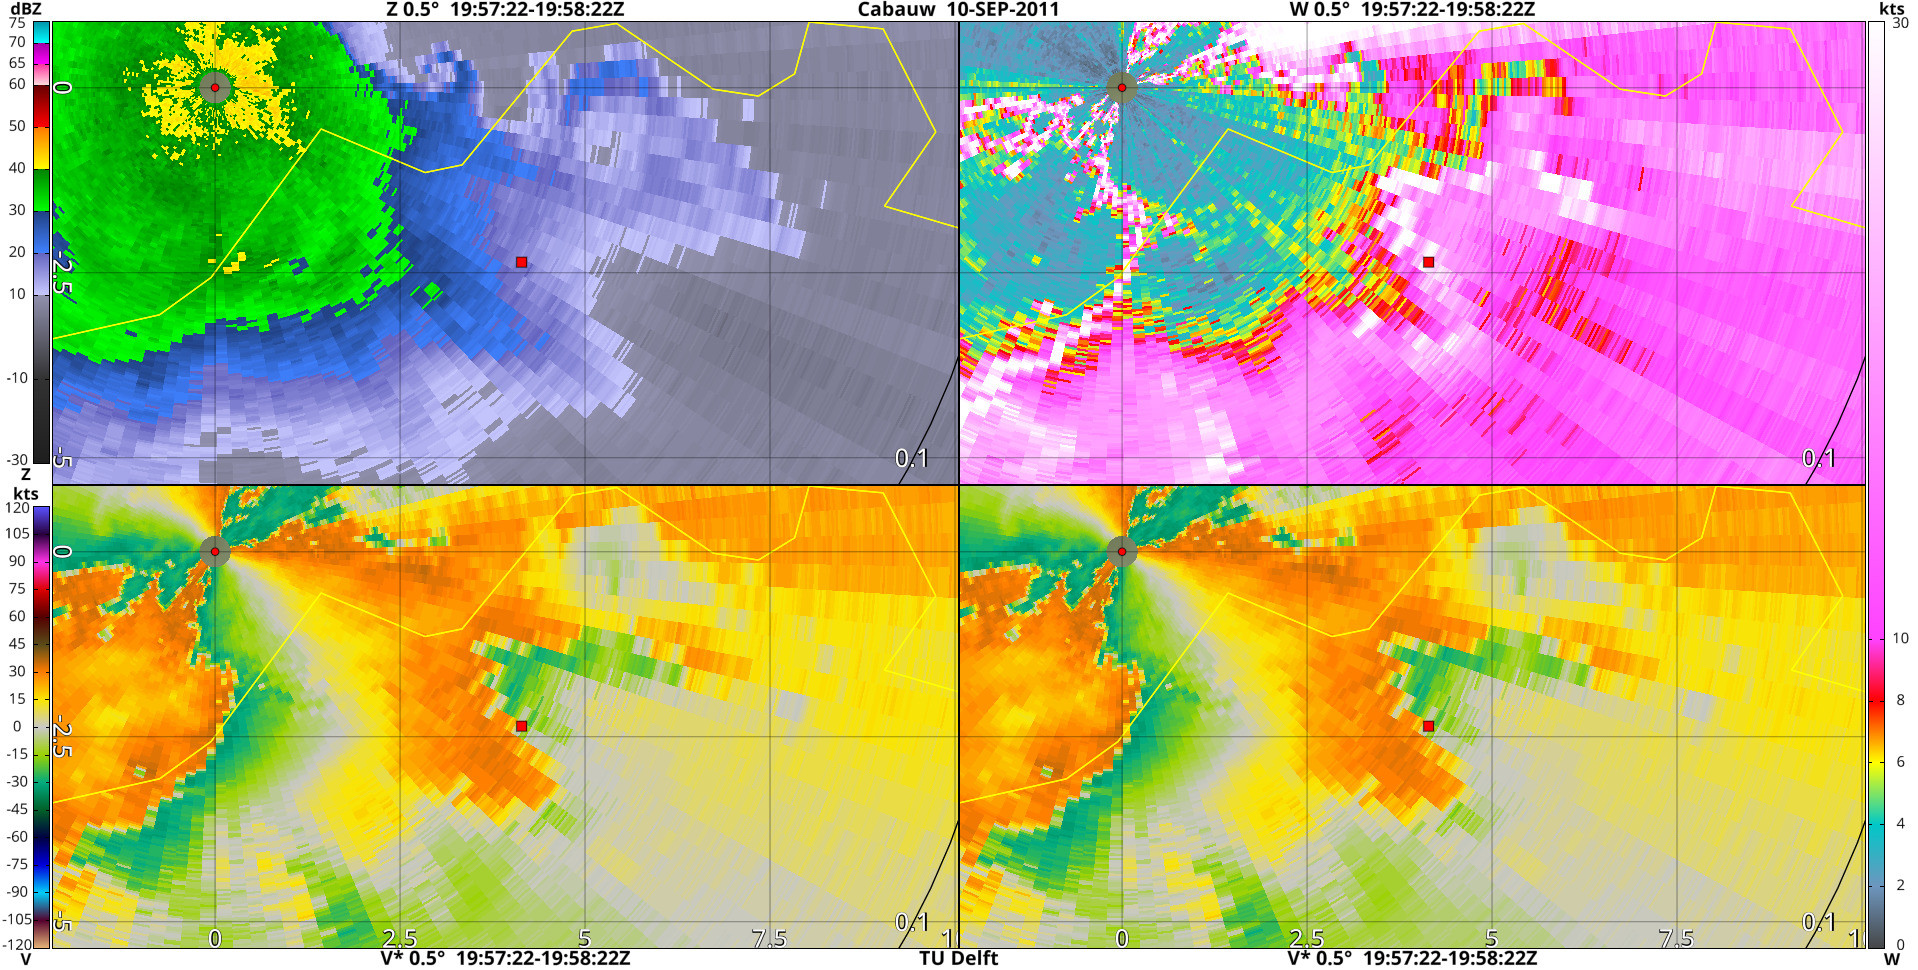
A tornado damaged a farm at the marked location on 10 September 2011: https://www.hartvannederland.nl/top-nieuws/2011/windhoos-richt-ravage-aan-2/, https://www.hartvannederland.nl/algemeen/2011/overlast-en-schade-door-noodweer/?sbs_device=false#831956. Radar shows two vortices close to each other, of which the one on the left passes over the marked location.
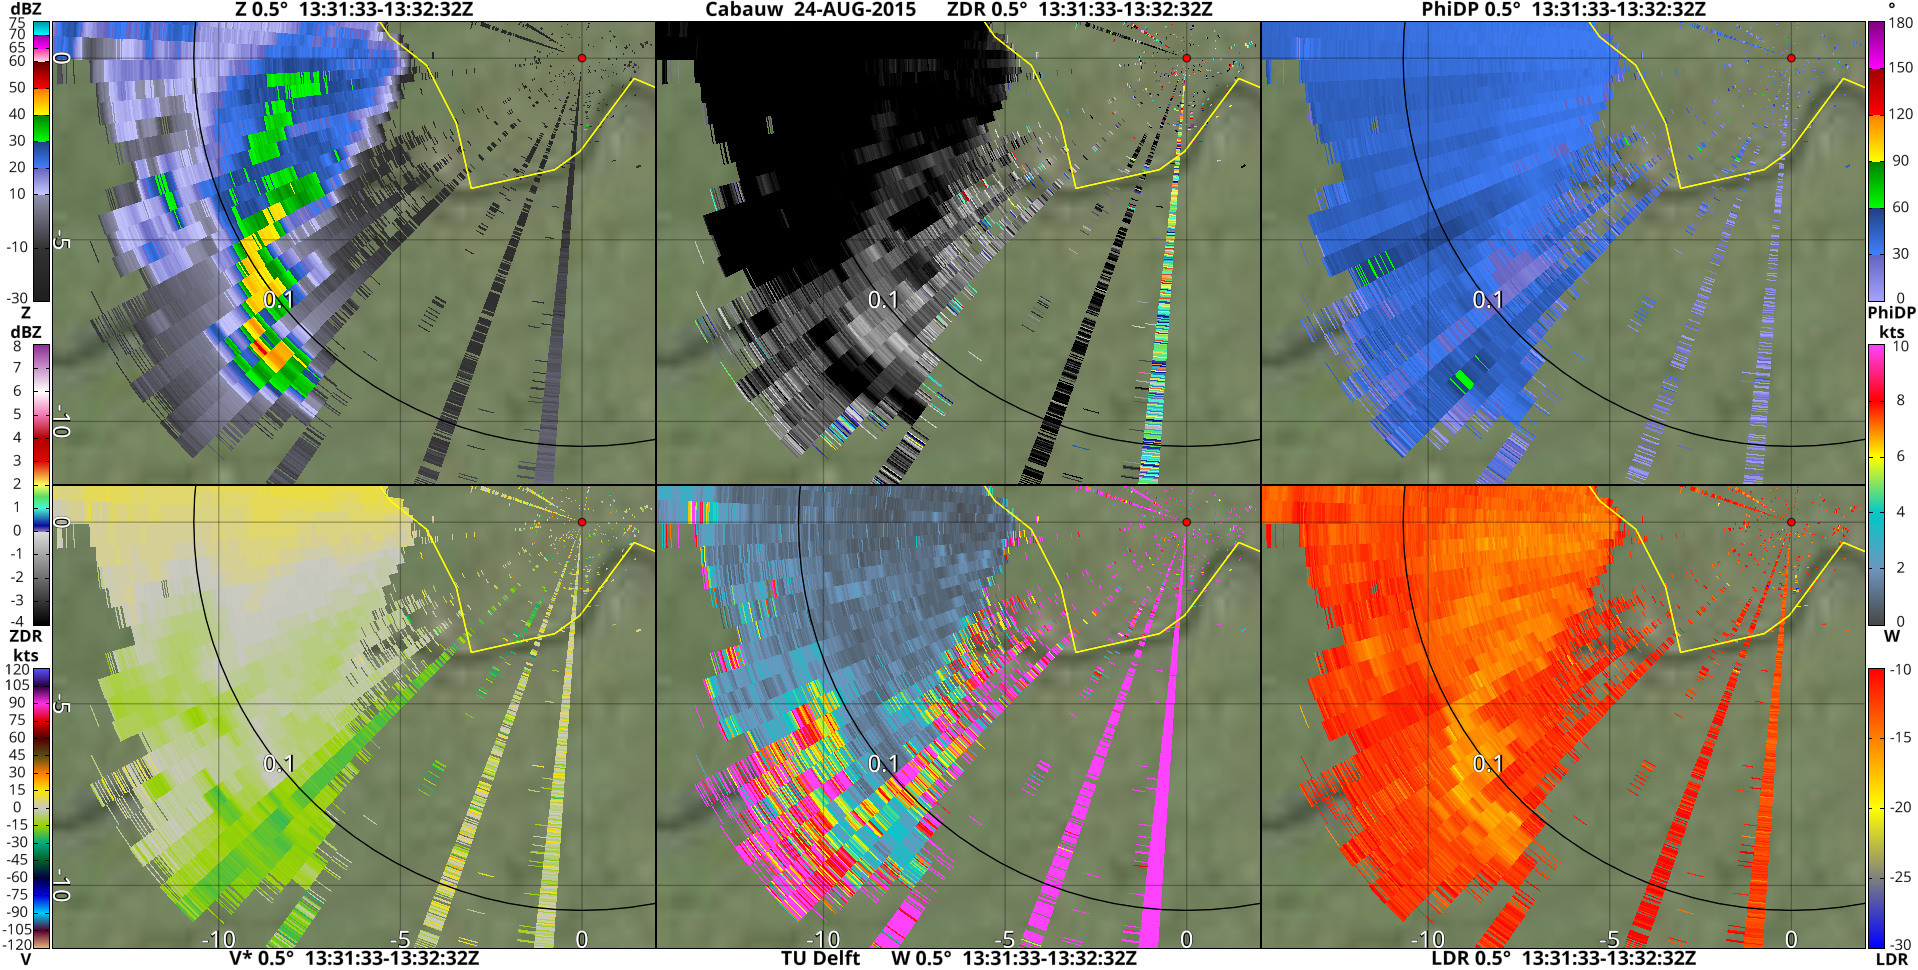
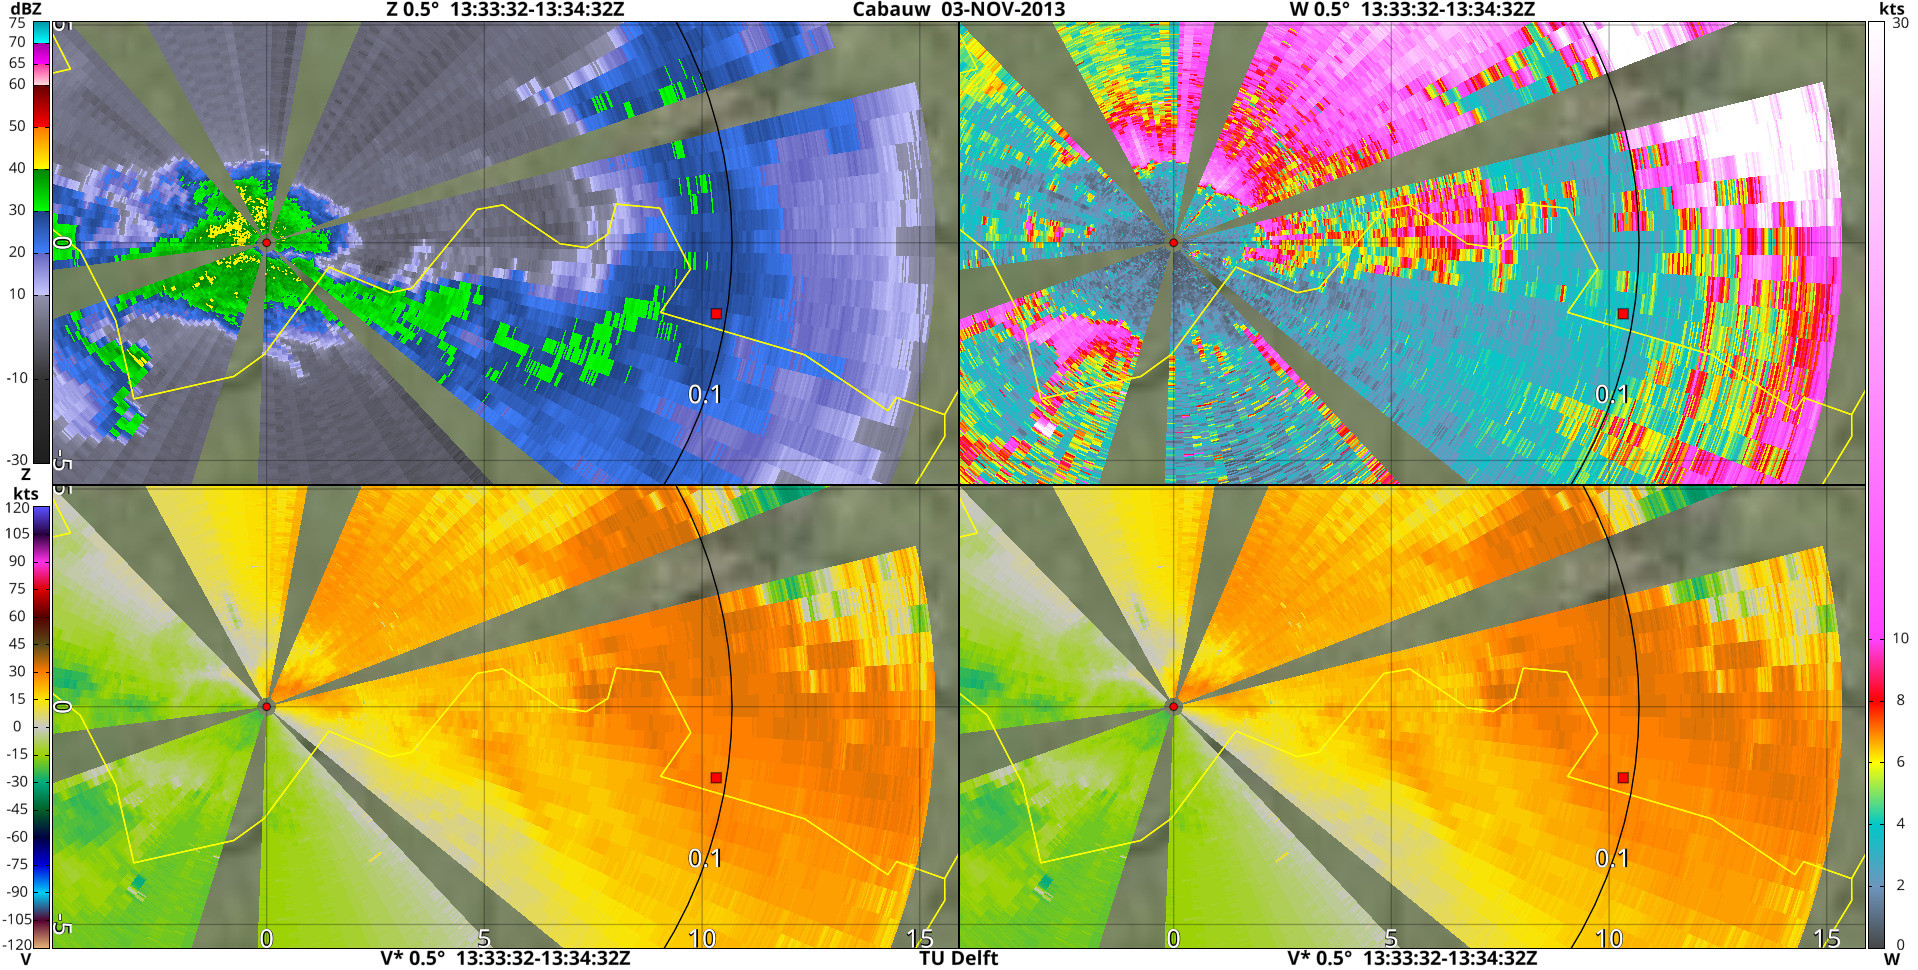
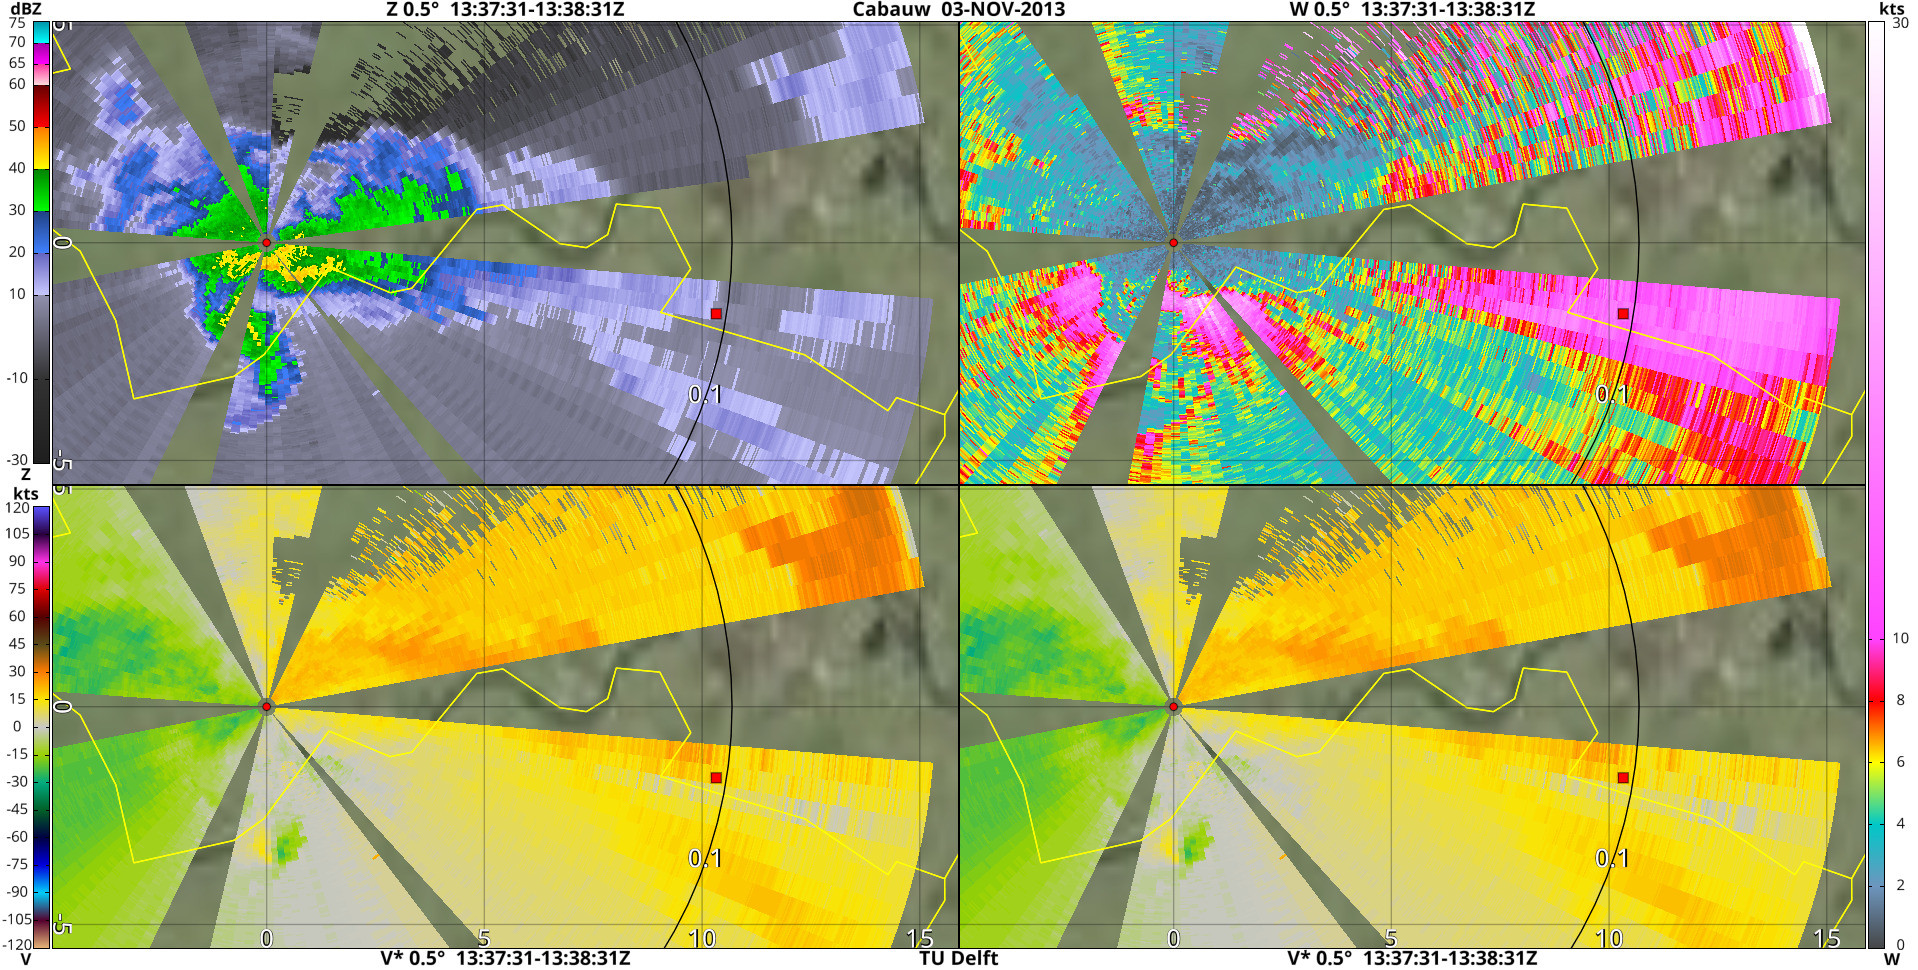
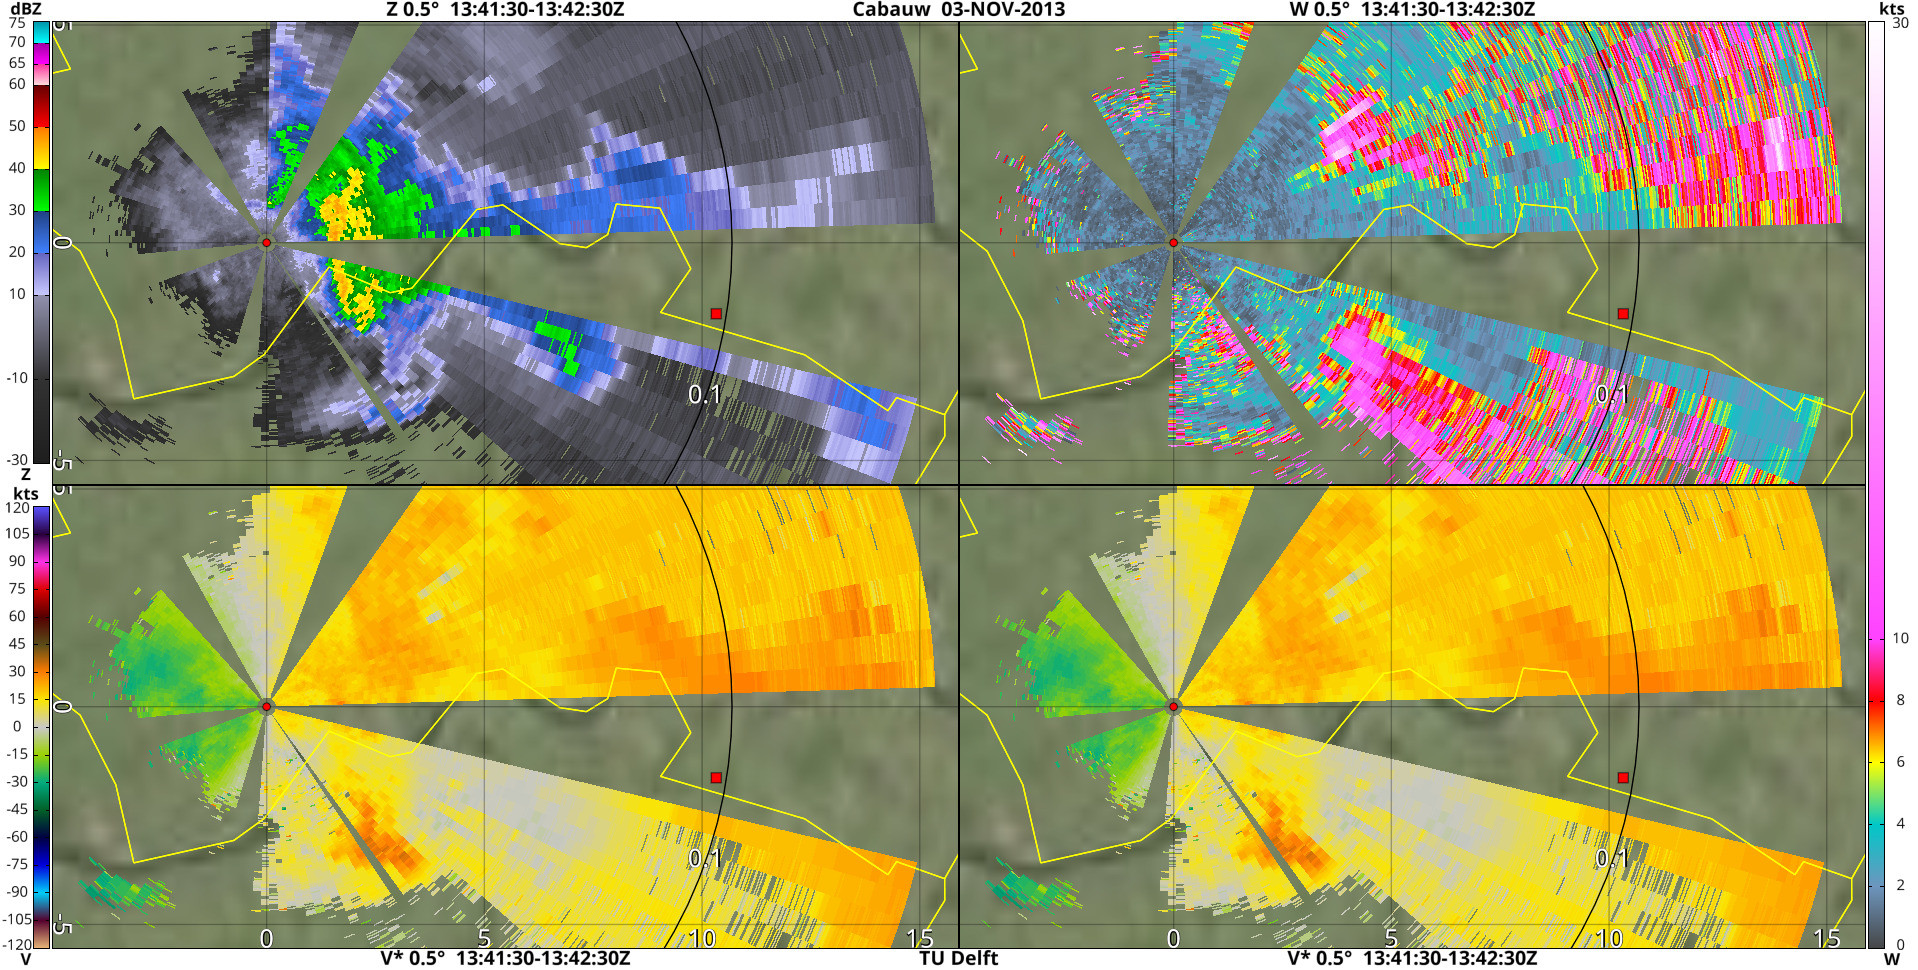
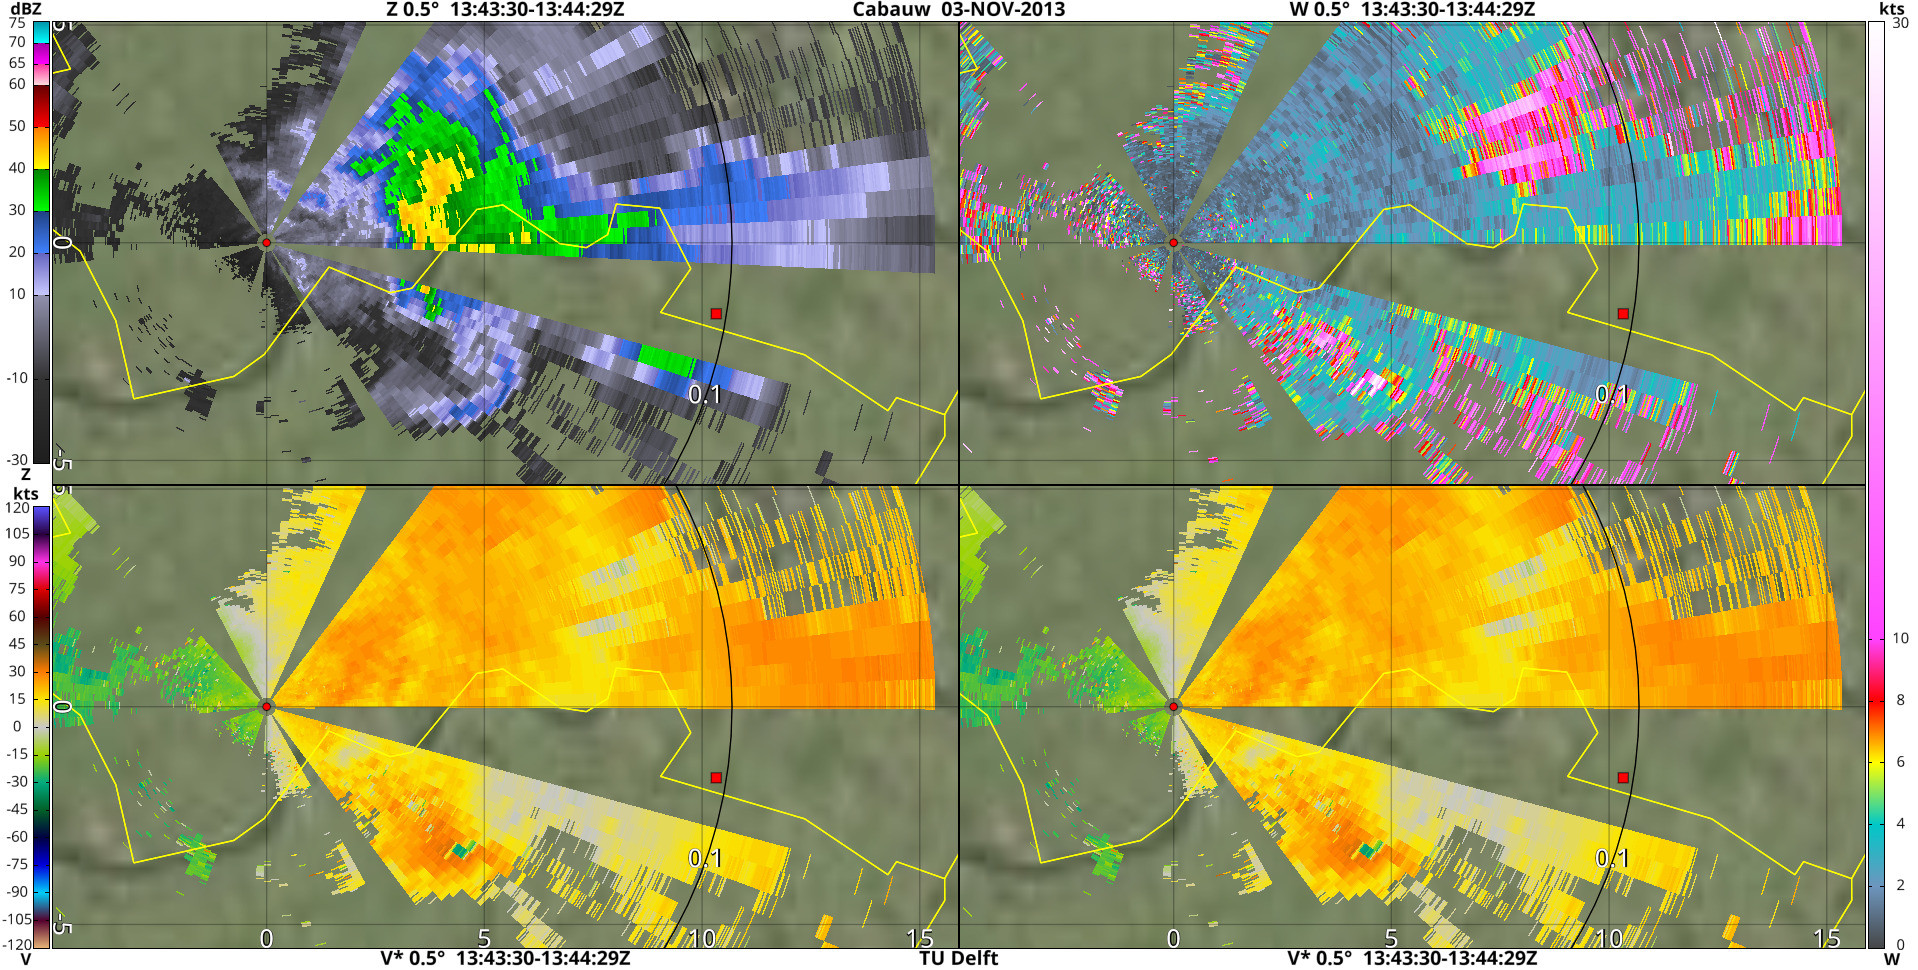
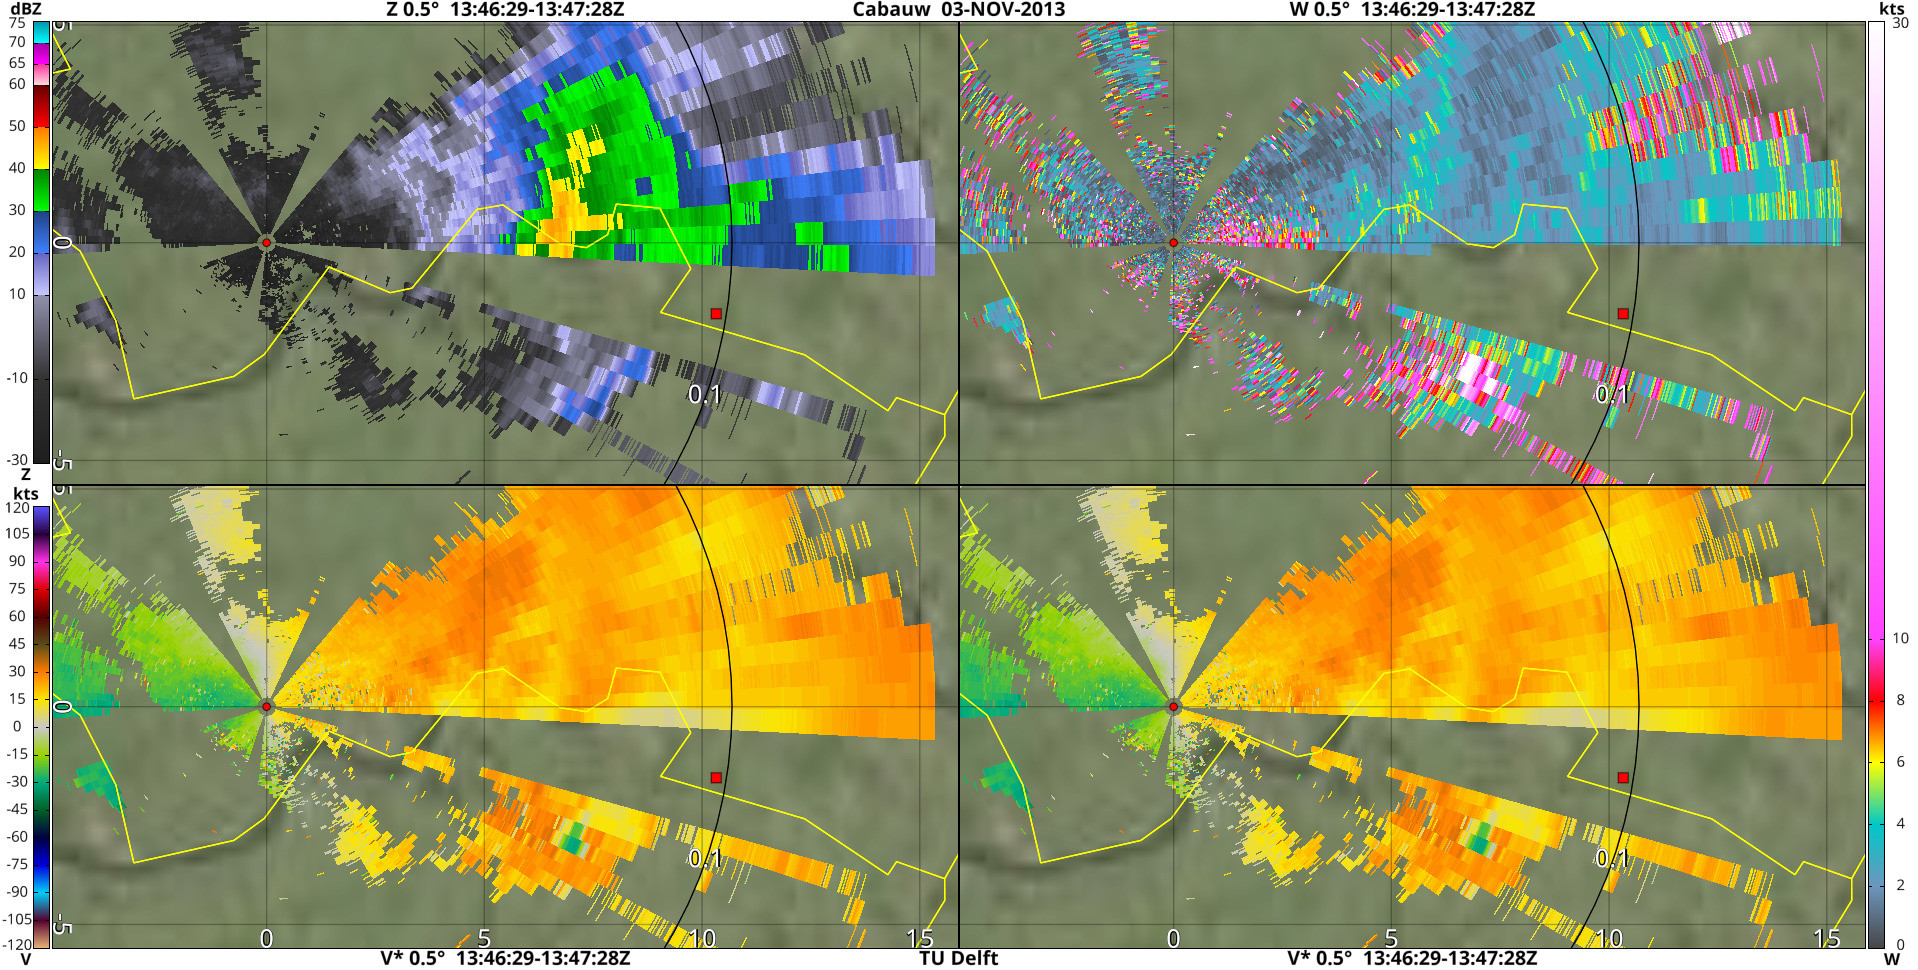
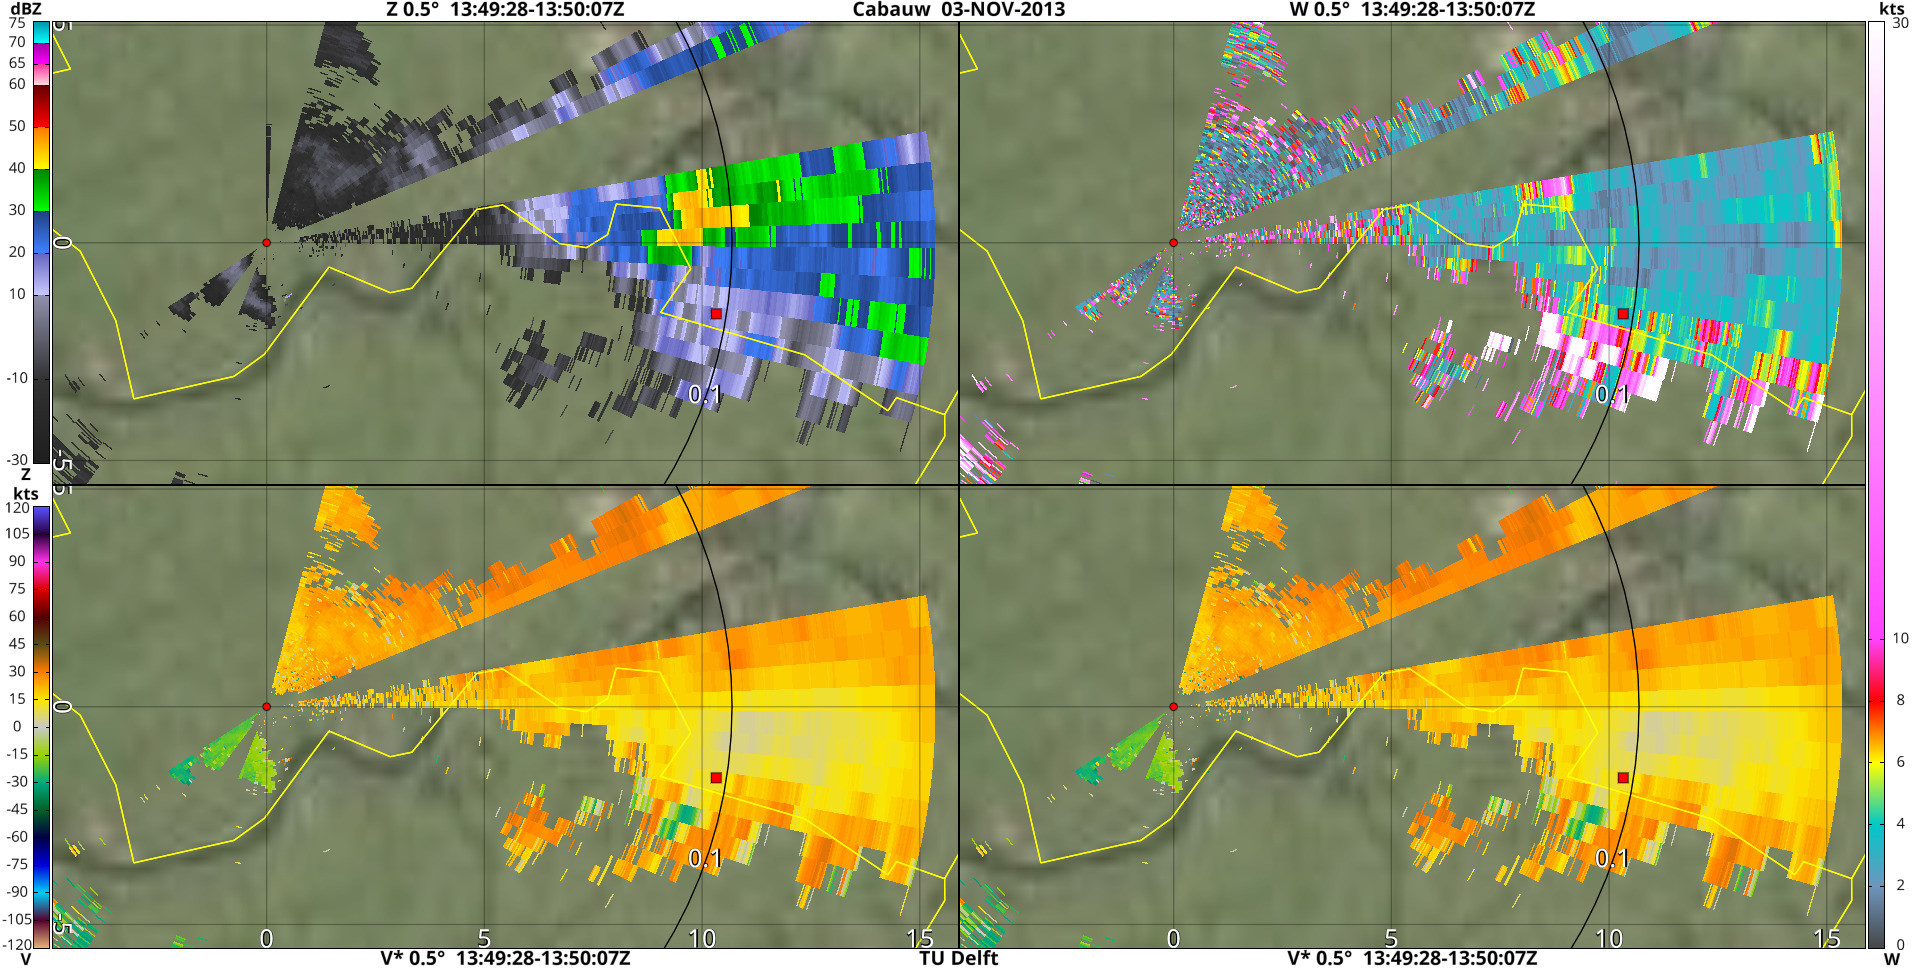
On 3 November 2013 a small tornadic supercell passed just south of Cabauw. It was very nicely visible on radar, although it really is a pity that the radar suffered from the issue with missing radial sectors on this day. Certain interesting time periods are missing as well. The marker in the images indicates the western-most location with reported damage. For if you want to read more about this case, here is a link to a report I wrote five years ago: https://drive.google.com/file/d/1lGN678PmUWb7kVZD4UNQ84--unqnF_tN/view?usp=sharing. This supercell would go on to produce a tornado in Wijk bij Duurstede, the most well-known and most damaging tornado of a day on which multiple tornadoes occurred in the Netherlands.
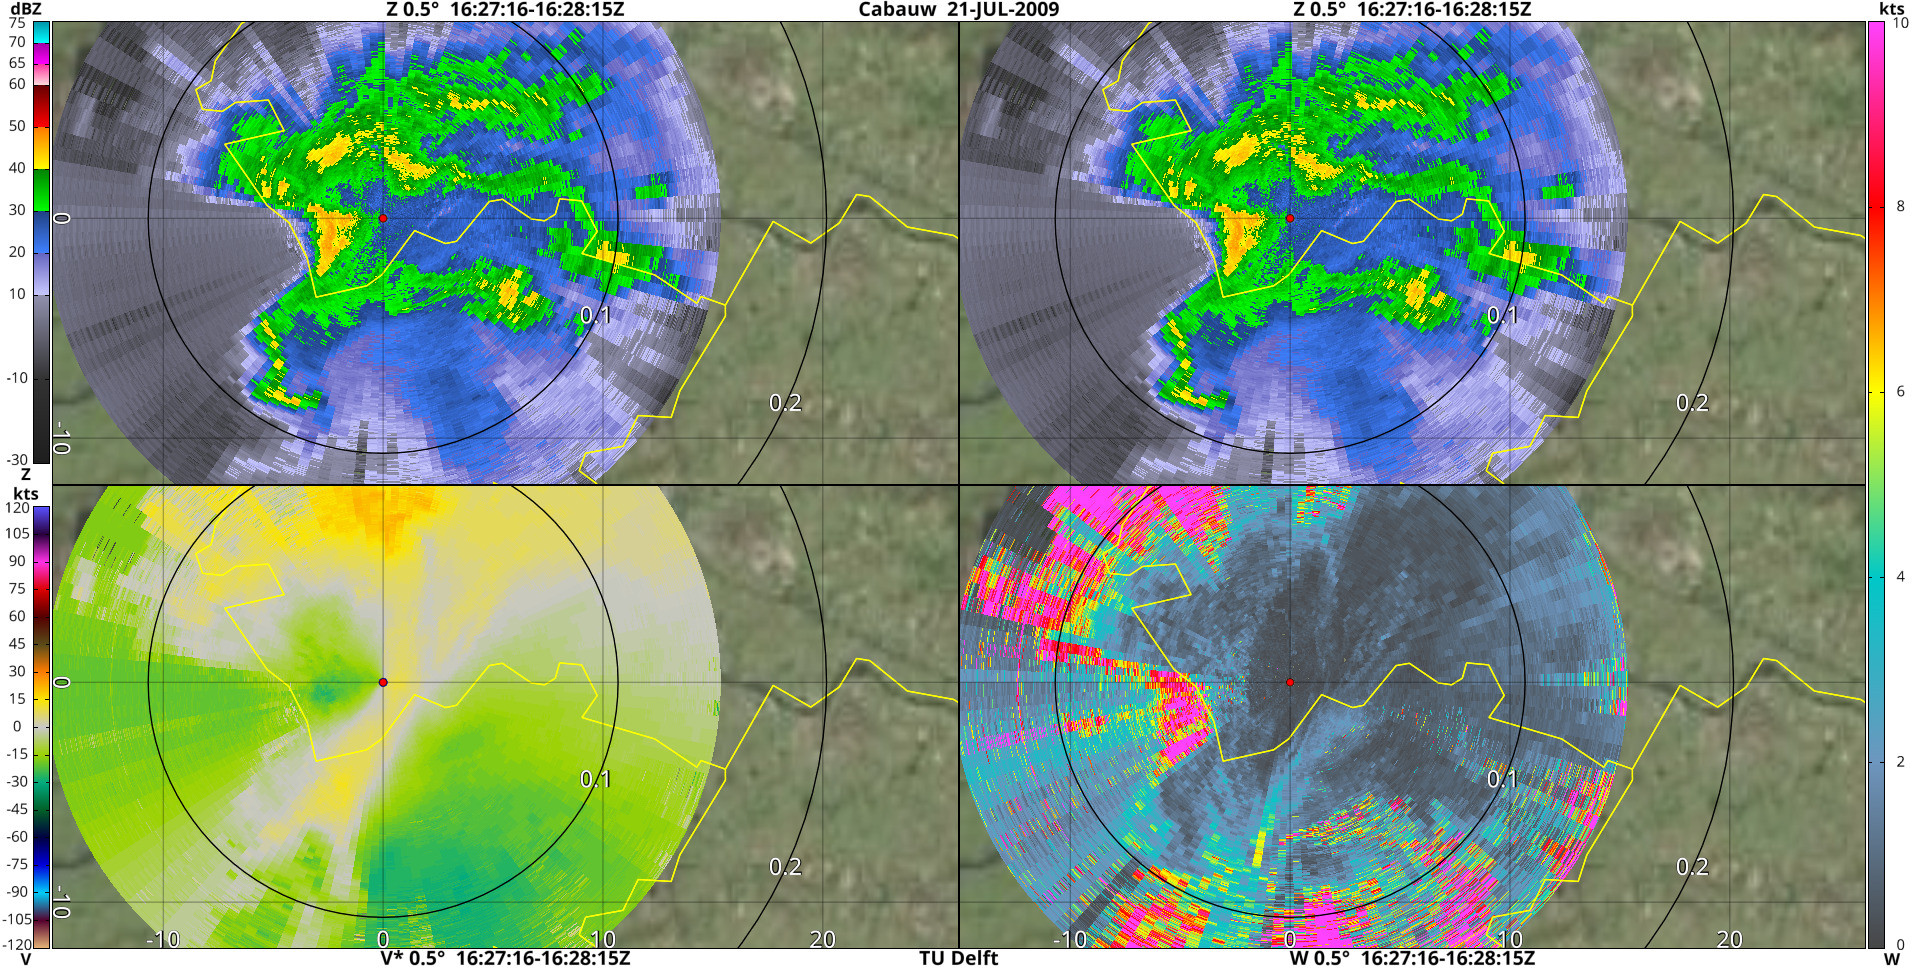
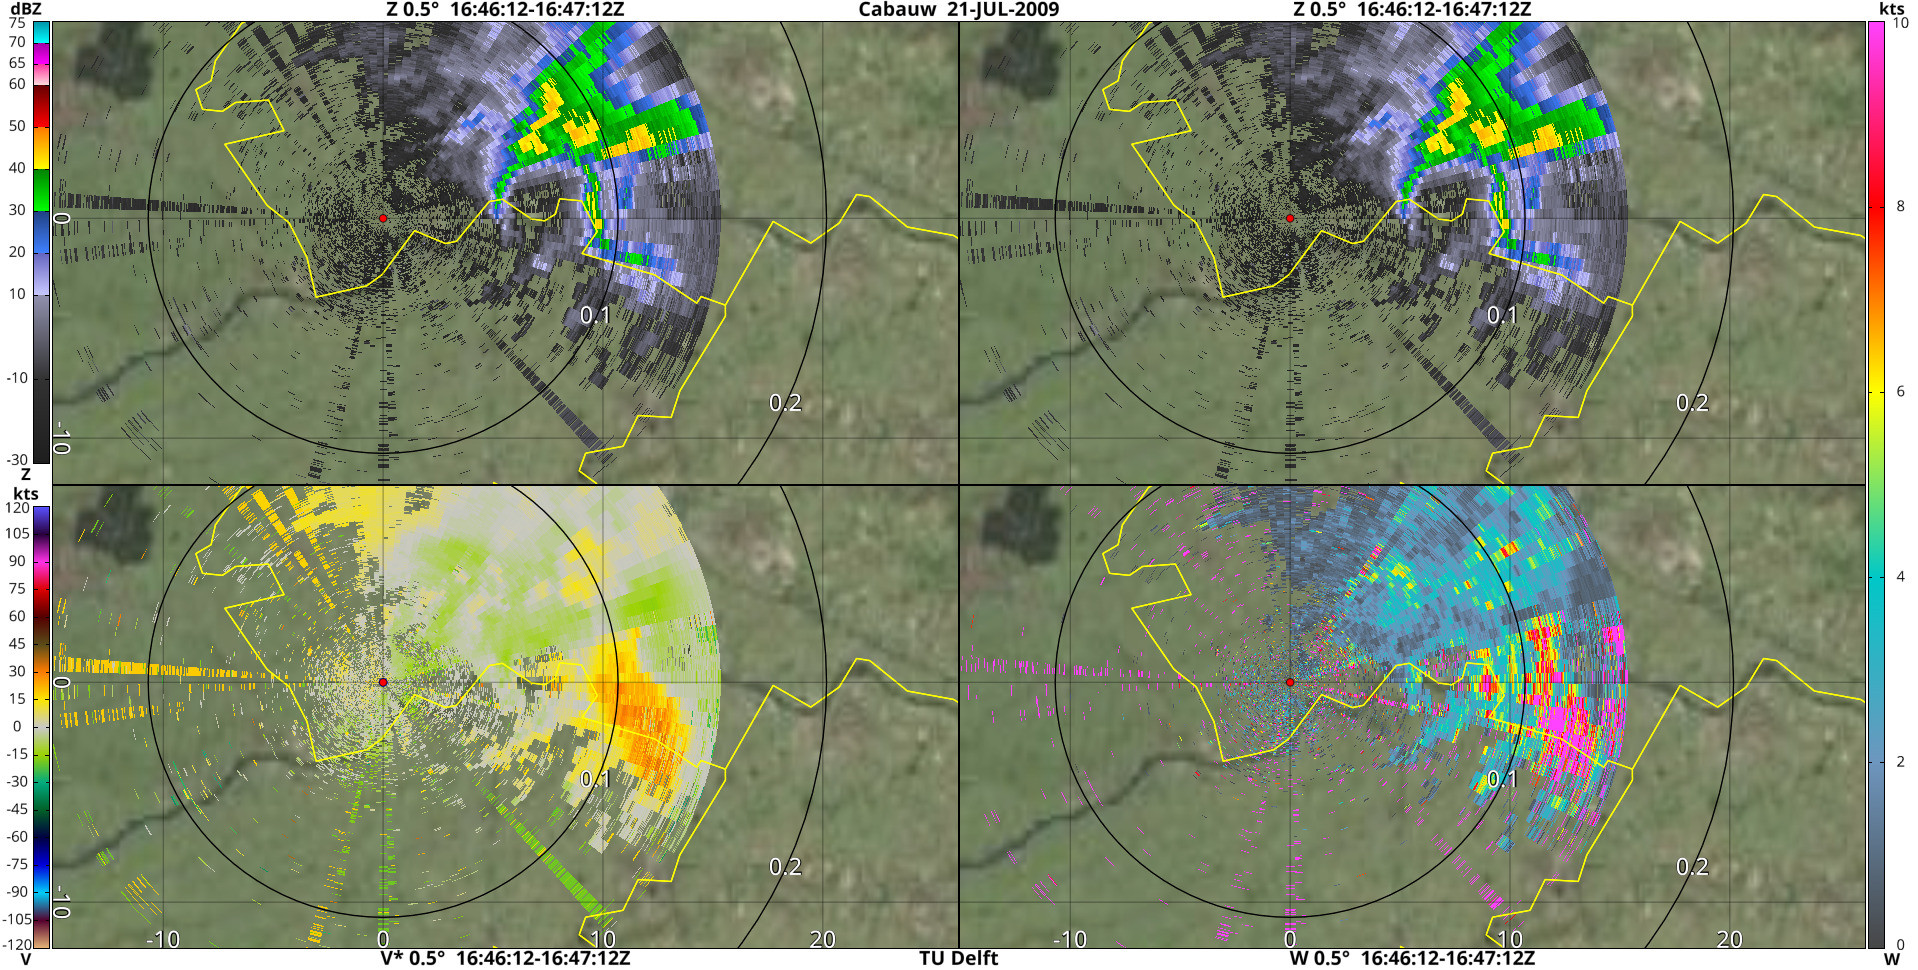
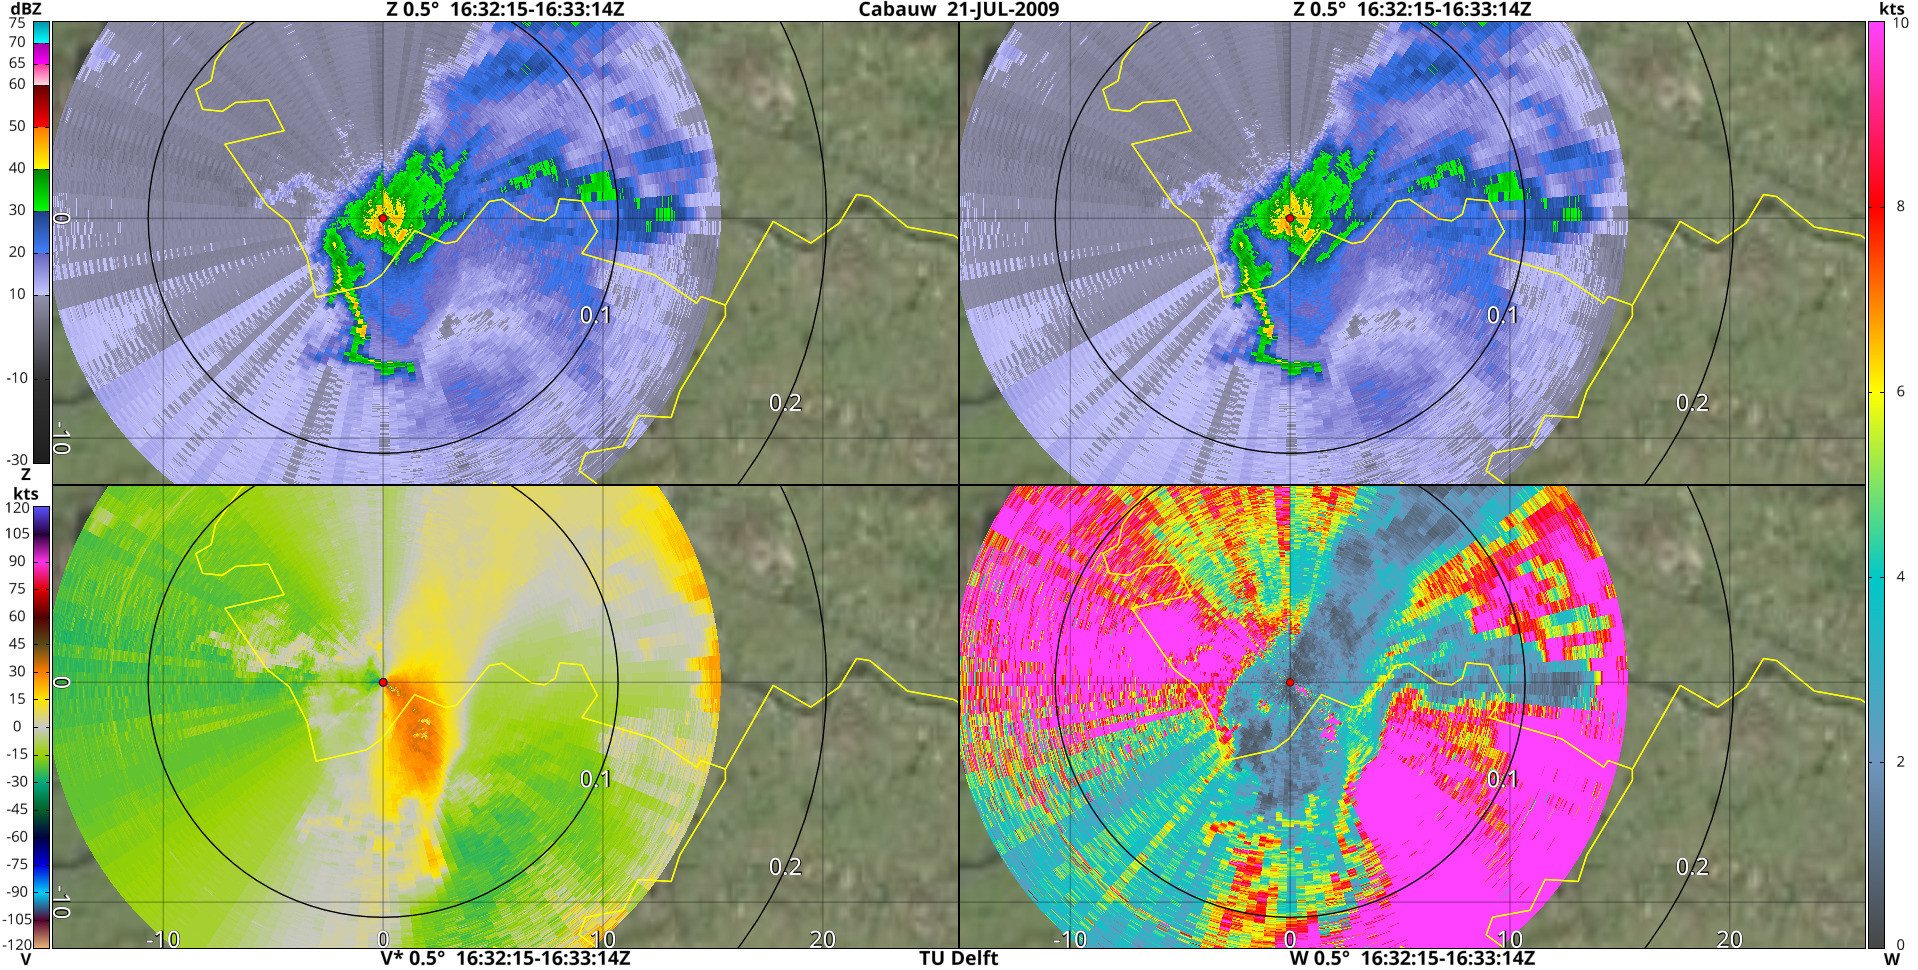
The system that produced a 127 km/h wind gust at KNMI's measurement station in Cabauw: