Uit: A MILLENNIUM OF WEATHER, WINDS AND WATER IN THE LOW COUNTRIES, Van Engelen, Buisman en IJnsen (rapport uit Climate Change, maart 2000). Op verzoek kan ik het hele artikel opsturen (gaat over homogeniteit en continuiteit van de reeks).
Gr. Ben
------------------------------
5. Spectral Analysis
In this section, we focus on the period 1321–1998 which is, in both seasons,
the period of reliable homogeneous reconstruction supplemented by observations
since 1706. The missing values in the winter and summer series (21 and 6 respectively)
were filled in by the respective long-term means (1.85 and 16.21 ◦C). The
oscillations are identified by application of the standard Fast Fourier Transform
(FFT).
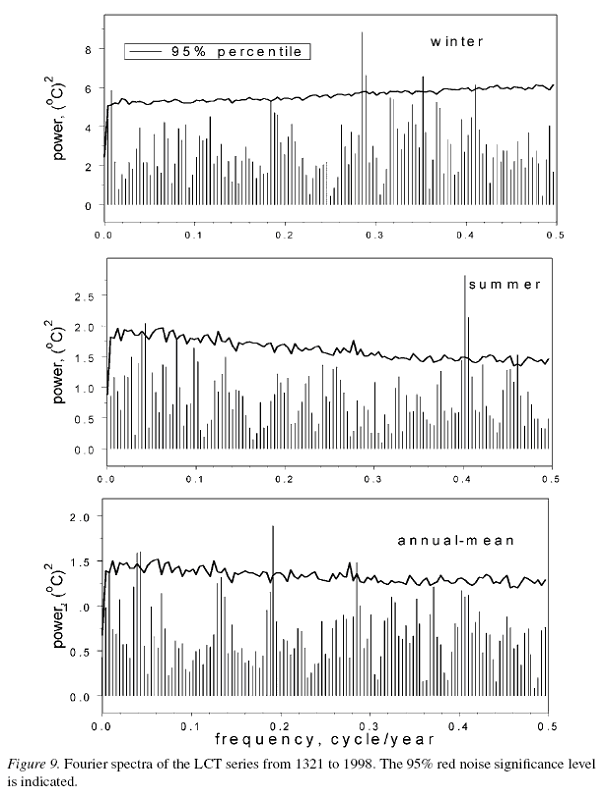
The FFT variance spectra of the LCT series over the period 1321–1998 are
shown in Figure 9. A number of significant oscillations emerge on interannual
timescales. In winter, the most prominent peak corresponds to the period of 3.5 yr.
We note that in the instrumental segment of the winter series analysed separately,
the 3.5 yr oscillation also appears prominent. The ~7.8 yr peak, being significant
in the instrumental segment of the winter LCT, is absent in its pre-instrumental
segment. In the summer series, the most pronounced oscillation has a period of
2.5 yr (2.2 yr in the instrumental segment). In the annual-mean LCT, there are
two significant oscillations on interannual timescales, with periods ~5.2 years and
~3.5 years (5.2 yr and 3.1 yr in the instrumental segment). The same periods were
identified by Benner (1999) in the annual-mean CET record.
On the low-frequency range, the summer (and annual-mean) LCT series exhibits
an oscillation with an approximately bidecadal timescale, ~24 year, which
is also characteristic for the instrumental segment analyzed separately. The winter
(and annual-mean) LCT series shows the significant concentration of power on
timescale ~120 year.
The temporal patterns of the ~120 year oscillation in Tw and Ta are almost
identical; the pattern in the annual-mean temperatures is shown in Figure 8. The
centennial oscillation is not a unique feature of the presently analysed reconstruction.
The ~120 year cycle has been detected in the CET record (Benner, 1999),
EUR series (Figure 8), as well as in the other paleo temperature proxy records
in the northern hemisphere (Shabalova and Weber, 1999; Hong et al., 2000). A
similar cycle is also characteristic for the solar irradiance series (Stuiver et al.,
1991), which suggests the solar-climate relation on centennial timescales.
An approximately bidecadal cycle has been identified in many instrumental and
proxy climate series reflecting variability on spatial scales from local (Baliunas
et al., 1997), through regional (Wang et al., 1991; Cook et al., 1998) to global
(Ghil and Vautard, 1991). In the LCT, the 24-yr summer mode is not robust. The
oscillation is best pronounced from the mid-1600s to the 1900s, and vanishes in
the first half of the 20th century. The bidecadal oscillation with the same properties
was reported for the CET record by Baliunas et al. (1997).
Thus, the temperature variability in the LCT series is characterized by a number
of oscillations inbedded in the predominantly white-noise background spectrum.
On interannual timescales, the oscillations found in the pre-instrumental segment
of the LCT do not differ much from those in the instrumental segment, except for the ~7.8 yr period in winter temperatures which is only present in the instrumental
segment. The dominant interannual timescales in the LCT have counterparts in the
CET record. On the low-frequency range, the LCT series display two characteristic
timescales: ~24 year in summer and ~120 year in winter. These cycles are shared
by a number of climatic records. The ~70 year oscillation identified earlier in the
European temperatures by Schlesinger and Ramankutty (1994) seems absent in the
LCT.
The seasonal dependence of the low-frequency components of temperature variability
in the LCT makes it difficult to establish any continuous interval in the past
which could be called undoubtedly warm or cold. The 10th and 15th centuries,
for instance, are on average warm in summer while cold in winter. On the other
hand, the period from the mid-1500s to 1700 is one of the coldest in both seasons,
and thus can be associated with the Little Ice Age in the Low Countries. The 20th
century is by far (three standard errors margin) the warmest in the winter LCT. In
the summer LCT, the 13th century is the warmest one, but by the narrow margin
(about one standard error). The seasonality of low-frequency temperature variability,
as identified in the LCT, is in line with the earlier analyses of instrumental
(Bradley and Jones, 1993; Datsenko et al., 2001) and paleo (Morgen and Ommen,
1997; Shabalova and Weber, 1999) data.
Gr. Ben
------------------------------
5. Spectral Analysis
In this section, we focus on the period 1321–1998 which is, in both seasons,
the period of reliable homogeneous reconstruction supplemented by observations
since 1706. The missing values in the winter and summer series (21 and 6 respectively)
were filled in by the respective long-term means (1.85 and 16.21 ◦C). The
oscillations are identified by application of the standard Fast Fourier Transform
(FFT).
The FFT variance spectra of the LCT series over the period 1321–1998 are
shown in Figure 9. A number of significant oscillations emerge on interannual
timescales. In winter, the most prominent peak corresponds to the period of 3.5 yr.
We note that in the instrumental segment of the winter series analysed separately,
the 3.5 yr oscillation also appears prominent. The ~7.8 yr peak, being significant
in the instrumental segment of the winter LCT, is absent in its pre-instrumental
segment. In the summer series, the most pronounced oscillation has a period of
2.5 yr (2.2 yr in the instrumental segment). In the annual-mean LCT, there are
two significant oscillations on interannual timescales, with periods ~5.2 years and
~3.5 years (5.2 yr and 3.1 yr in the instrumental segment). The same periods were
identified by Benner (1999) in the annual-mean CET record.
On the low-frequency range, the summer (and annual-mean) LCT series exhibits
an oscillation with an approximately bidecadal timescale, ~24 year, which
is also characteristic for the instrumental segment analyzed separately. The winter
(and annual-mean) LCT series shows the significant concentration of power on
timescale ~120 year.
The temporal patterns of the ~120 year oscillation in Tw and Ta are almost
identical; the pattern in the annual-mean temperatures is shown in Figure 8. The
centennial oscillation is not a unique feature of the presently analysed reconstruction.
The ~120 year cycle has been detected in the CET record (Benner, 1999),
EUR series (Figure 8), as well as in the other paleo temperature proxy records
in the northern hemisphere (Shabalova and Weber, 1999; Hong et al., 2000). A
similar cycle is also characteristic for the solar irradiance series (Stuiver et al.,
1991), which suggests the solar-climate relation on centennial timescales.
An approximately bidecadal cycle has been identified in many instrumental and
proxy climate series reflecting variability on spatial scales from local (Baliunas
et al., 1997), through regional (Wang et al., 1991; Cook et al., 1998) to global
(Ghil and Vautard, 1991). In the LCT, the 24-yr summer mode is not robust. The
oscillation is best pronounced from the mid-1600s to the 1900s, and vanishes in
the first half of the 20th century. The bidecadal oscillation with the same properties
was reported for the CET record by Baliunas et al. (1997).
Thus, the temperature variability in the LCT series is characterized by a number
of oscillations inbedded in the predominantly white-noise background spectrum.
On interannual timescales, the oscillations found in the pre-instrumental segment
of the LCT do not differ much from those in the instrumental segment, except for the ~7.8 yr period in winter temperatures which is only present in the instrumental
segment. The dominant interannual timescales in the LCT have counterparts in the
CET record. On the low-frequency range, the LCT series display two characteristic
timescales: ~24 year in summer and ~120 year in winter. These cycles are shared
by a number of climatic records. The ~70 year oscillation identified earlier in the
European temperatures by Schlesinger and Ramankutty (1994) seems absent in the
LCT.
The seasonal dependence of the low-frequency components of temperature variability
in the LCT makes it difficult to establish any continuous interval in the past
which could be called undoubtedly warm or cold. The 10th and 15th centuries,
for instance, are on average warm in summer while cold in winter. On the other
hand, the period from the mid-1500s to 1700 is one of the coldest in both seasons,
and thus can be associated with the Little Ice Age in the Low Countries. The 20th
century is by far (three standard errors margin) the warmest in the winter LCT. In
the summer LCT, the 13th century is the warmest one, but by the narrow margin
(about one standard error). The seasonality of low-frequency temperature variability,
as identified in the LCT, is in line with the earlier analyses of instrumental
(Bradley and Jones, 1993; Datsenko et al., 2001) and paleo (Morgen and Ommen,
1997; Shabalova and Weber, 1999) data.