Is die stralingsbalans verstoring van 0,85 W/m2 al gemeten of is die gebaseerd op de vergelijking tussen de warmteinhoud van de oceanen met de gemodelleerde stralingsforcering? (J.Hansen et al 2005)
Uit het artikel:
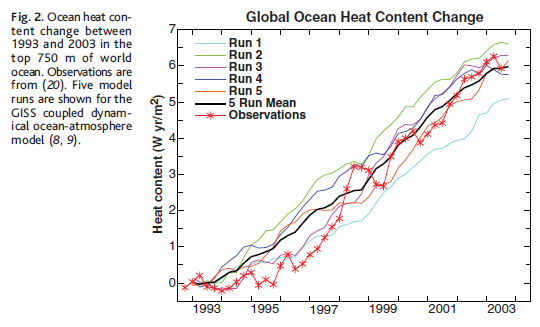
Confirmation of the planetary energy imbalance can be obtained by measuring the heat content of the ocean, which must be the principal reservoir for excess energy (3, 15). Levitus et al. (15) compiled ocean temperature data that yielded increased ocean heat content of about 10 W year/m², averaged over the Earth’s surface, during 1955 to 1998 [1 W year/m² over the full Earth ~ 1.61 x 10²² J]. Total ocean heat storage in that period is consistent with climate model simulations (16–19), but the models do not reproduce reported decadal fluctuations. The fluctuations may be a result of variability of ocean dynamics (17) or, at least in part, an artifact of incomplete sampling of a dynamically variable ocean (18, 19). Improved definition of Earth’s energy balance is possible for the past decade. First, the predicted energy imbalance due to increasing GHGs has grown to 0.85 ± 0.15 W/m2, and the past decade has been uninterrupted by any large volcanic eruption (Fig. 1). Second, more complete ocean temperature data are available, including more profiling floats and precise satellite altimetry that permits improved estimates in data-sparse regions (20). Figure 2 shows that the modeled increase of heat content in the past decade in the upper 750 m of the ocean is 6.0 ± 0.6 (mean ± SD) W year/m2, averaged over the surface of Earth, varying from 5.0 to 6.6 W year/m2 among five simulations. The observed annual mean rate of ocean heat gain between 1993 and mid-2003 was 0.86 ± 0.12 W/m² per year for the 93.4% of the ocean that was analyzed (20). Assuming the same rate for the remaining 6.6% of the ocean yields a global mean heat storage rate of 0.7 x 0.86 = 0.60 ± 0.10 W/m² per year or 6 ± 1 W year/m2 for 10 years, 0.7 being the ocean fraction of Earth’s surface. This agrees well with the 5.5 W year/m2 in the analysis of Levitus et al. (21) for the upper 700 m that was based only on in situ data.
De verstoring is dus 'gemeten', in de zin dat deze is berekend uit de warmteinhoud van de oceanen, die weer bepaald is uit jarenlange waarnemingen van de zeewatertemperatuur. De waarde van 0,85 W/m² is geen resultaat van een berekening waar een gemodelleerde stralingsforcering in gaat, de waarde wordt wel vergeleken met modellen om deze te verifiëren. Figuur 2 waar naar verwezen wordt zie je hieronder.
Ik ben wel geïnteresseerd in het model dat je ontwikkeld hebt, misschien valt het uit te breiden naar een 3D model (d.w.z. het model inzetten op een grid van lat-lon punten). De versimpelde vergelijkingen voor diverse forceringen (ik neem aan dat je die bedoelt die je hier vindt) bevatten géén sneeuw en ijs albedo-feedback in. De uitgebreide definitie van stralingsforcering die zij hanteren vind je hier (kort is het ,,the change in net (down minus up) irradiance (solar plus longwave; in W m–2) at the tropopause after allowing for stratospheric temperatures to readjust to radiative equilibrium, but with surface and tropospheric temperatures and state held fixed at the unperturbed values'').
Gr. Ben
Bericht laatst bijgewerkt: 11-09-2008 18:36