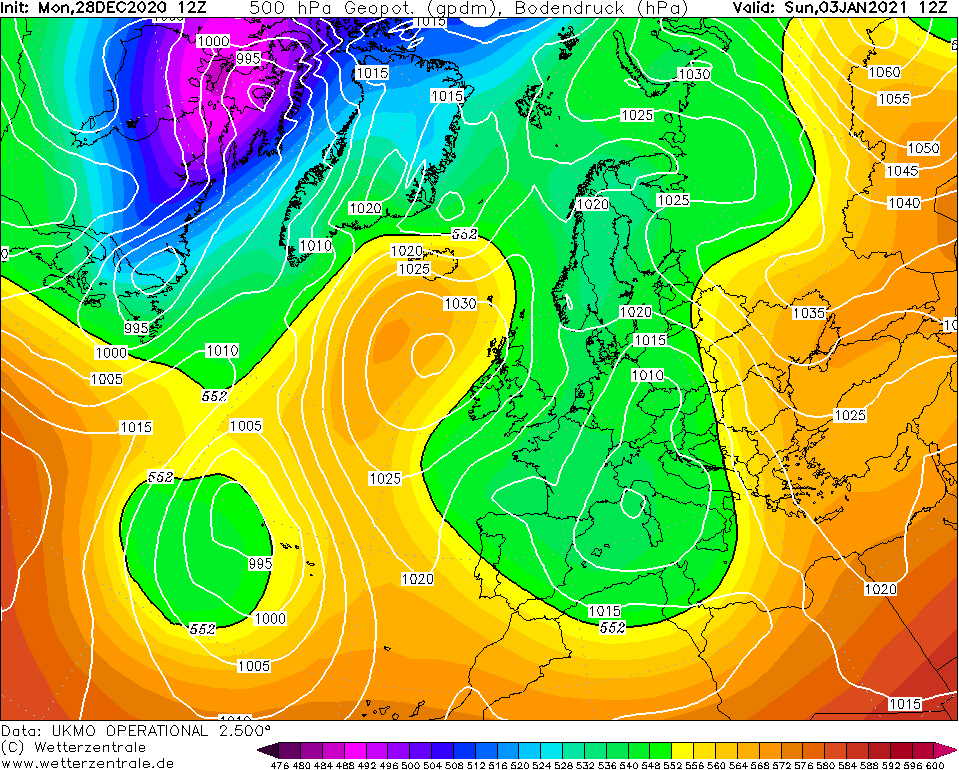
Eerder vanmiddag interpreteerde jij de kaarten voor 144-240 uur als European Blocking (zie citaat onder). Echter, door de lagere geo's boven de Middellandse Zee vind ik dat ook niet helemaal accuraat. Voor mij houdt het het midden tussen Atlantic Ridge en Scandinavian Blocking. Hoe dan ook nog steeds geen Groenlandblokkade en dus 'niks aan de hand', maar ik wilde het toch even kwijt...
En laten we ook vooral niet balen van een Groenlandhoog, zoals bij GFS. Liever één vogel in de hand dan tien in de lucht.
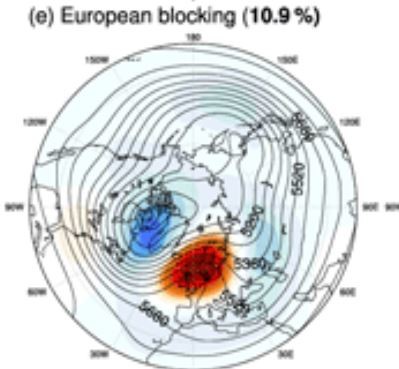
Hoe ik de kaarten interpreteer is dat we een European Blocking zien. Hogedruk van Engeland naar het NO. Lagedruk ten westen van Groenland. Ik twijfelde met Scandinavian Blocking, maar daar zie je duidelijk een zuidelijke jet
Met alle mitsen en maren die aan deze studie zitten. We werken met de kennis die we hebben  Ik kan er naast zitten hoor bij het interpreteren. Dat maakt het ook lastig.
Scandinavische blocking heb ik al uitgelegd waarom dat verkeerd is -> namelijk zuidelijke jet. Atl rug is het ook niet, want je ziet daar lagere druk dan normaal in het oosten van Europa. Kijk je naar European Blocking en de kaart van EC, dan zie je daar de meeste overeenkomsten mee. Het gaat om de NAE-regio. Middellandse Zeegebied telt niet mee in de beoordeling. Het gaat om het dominante patroon in een periode van tien dagen.
https://wcd.copernicus.org/articles/1/373/2020/
Niks aan de hand schrijf je, daar kan ik deels mee eens zijn, dat het prettig is dat we geen GL zien (vanuit dit oogpunt), maar de andere settings beloven op voorhand minder. Ik wil de jackpot. Jij vast ook
Je stelt dat 'we' niet moeten balen van een GL hoog, maar dat is dus -vanuit deze studie gezien- wel de juiste mening. Want we willen toch graag een langdurige impact en niet met een Atl. trog zitten over 2-3 weken.
------------------------------------------------------------------------------------------------------------------------------------
We now subdivide the 25 SSW events with respect to the weather regime that dominates during the 10 d around the SSW onset: GL (five cases), EuBL (seven cases), and the cyclonic regimes (ZO, ScTr, AT; eight cases). The remaining five cases either have no clear regime signature (no regime, two events) or are associated with AR (three events) at their onset. Because of the small sample size, we do not consider these cases here. For the GL subset (Figs. 2b, A2b), all other regimes are subsequently suppressed except for AT and EuBL. The frequency of GL itself drops immediately after the SSW, reaching values below 10 % around a lag of 20 d (Fig. A2b) – far below its climatological mean frequency. AT, and to a lesser degree also EuBL, become significantly more frequent immediately after the SSW until about a lag of 10 d, reaching absolute frequencies of 35 % and 20 %, respectively (Fig. A2b). After a period with no clear regime assignment, AT becomes the dominant regime starting at lag 18 d with anomalous frequencies above 40 % (Fig. 2b), peaking above 50 % absolute frequency about 23 d after the SSW and remaining significantly enhanced until a lag of 33 d (Fig. A2b). From lag 25 d until lag 40 d, EuBL becomes significantly enhanced, peaking at 40 % absolute frequency around lag 30 d.
For the EuBL subset (Figs. 2c, A2c), the subsequent regime frequencies are quite different to GL around the onset of an SSW. First, the frequency of AR is significantly enhanced directly after the SSW, with peaks at 30 % absolute frequency at lag 10 d. This is then followed by a period of preferred occurrence of GL (lag 15 to 25 d) and AT (lag 21 to 32 d) with an absolute frequency reaching up to 45 % and 35 %, respectively. The dominance of GL from lag 33 to 45 d (above 45 % peak frequency) is particularly striking.
Cyclonic regimes around the time of the SSW (Fig. 2d, A2d) exhibit a less prominent regime frequency modulation after an SSW compared to the EuBL and GL subsets. Still, GL (lag 5–35 d), AR (lag 24–31 d), and AT (lag 25–37 d) are significantly enhanced, but absolute frequencies remain around 20 %–30 %. Note that this corresponds to significantly increased frequencies of 10 %–20 % for these regimes in the considered time windows. However, most often no single regime dominates after an SSW event with a cyclonic regime at lag 0, hinting at cases with no downward response after the SSW event. Of the eight SSWs with cyclonic weather regimes at lag 0, Karpechko et al. (2017) investigated seven and classified five out of the seven SSW events as lacking a tropospheric impact. For EuBL and GL around the onset of the SSW, seven out of seven and one out of five, respectively, are classified as having a tropospheric impact. The reasons for this will be discussed in the next section.
Despite the large tropospheric variability in the aftermath of SSW events, the investigation of lagged regime frequencies reveals that (1) the AT and GL regimes are more likely to follow an SSW (as compared to other weather regimes) and (2) that this subsequent modulation is sensitive to the tropospheric flow regime around the onset of the SSW. The dominance of EuBL and GL at the time of the SSW onset hints at a significantly more likely GL response (after EuBL at lag 0) vs. AT (after GL at lag 0) after an SSW, respectively. Thus the stratospheric impact on the evolution of the tropospheric flow in the NAE region and hence the associated surface weather may be connected to the presence of a particular tropospheric regime around the onset of the SSW.